LensCrafters 2015 Annual Report Download - page 155
Download and view the complete annual report
Please find page 155 of the 2015 LensCrafters annual report below. You can navigate through the pages in the report by either clicking on the pages listed below, or by using the keyword search tool below to find specific information within the annual report.-
 1
1 -
2
-
3
-
4
-
5
-
6
-
7
-
8
-
9
-
10
-
11
-
12
-
13
-
14
-
15
-
16
-
17
-
18
-
19
-
20
-
21
-
22
-
23
-
24
-
25
-
26
-
27
-
28
-
29
-
30
-
31
-
32
-
33
-
34
-
35
-
36
-
37
-
38
-
39
-
40
-
41
-
42
-
43
-
44
-
45
-
46
-
47
-
48
-
49
-
50
-
51
-
52
-
53
-
54
-
55
-
56
-
57
-
58
-
59
-
60
-
61
-
62
-
63
-
64
-
65
-
66
-
67
-
68
-
69
-
70
-
71
-
72
-
73
-
74
-
75
-
76
-
77
-
78
-
79
-
80
-
81
-
82
-
83
-
84
-
85
-
86
-
87
-
88
-
89
-
90
-
91
-
92
-
93
-
94
-
95
-
96
-
97
-
98
-
99
-
100
-
101
-
102
-
103
-
104
-
105
-
106
-
107
-
108
-
109
-
110
-
111
-
112
-
113
-
114
-
115
-
116
-
117
-
118
-
119
-
120
-
121
-
122
-
123
-
124
-
125
-
126
-
127
-
128
-
129
-
130
-
131
-
132
-
133
-
134
-
135
-
136
-
137
-
138
-
139
-
140
-
141
-
142
-
143
-
144
-
 145
145 -
 146
146 -
 147
147 -
 148
148 -
 149
149 -
 150
150 -
 151
151 -
 152
152 -
 153
153 -
 154
154 -
 155
155 -
 156
156 -
 157
157 -
 158
158 -
 159
159 -
 160
160 -
 161
161 -
 162
162 -
 163
163 -
 164
164 -
 165
165 -
166
-
167
-
168
-
169
-
170
-
171
-
172
-
173
-
174
-
175
-
176
-
177
-
178
-
179
-
180
-
181
-
182
-
183
-
184
-
185
-
186
-
187
-
188
-
189
-
190
-
191
-
192
-
193
-
194
-
195
-
196
-
197
-
198
-
199
-
200
-
201
-
202
-
203
-
204
-
205
-
206
-
207
-
208
-
209
-
210
-
211
-
212
-
213
-
214
-
215
-
216
-
217
-
218
-
219
-
220
-
221
-
222
-
223
-
224
-
225
-
226
-
227
-
228
-
229
-
230
-
231
-
232
-
233
-
234
-
235
-
236
-
237
-
238
-
239
-
240
-
241
-
242
-
243
-
244
-
245
-
246
-
247
-
248
-
249
-
250
-
251
-
252
-
253
-
254
-
255
-
256
-
257
-
258
-
259
-
260
-
261
-
262
-
263
-
264
-
265
-
266
-
267
-
268
-
269
-
270
 |
 |

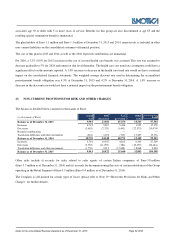
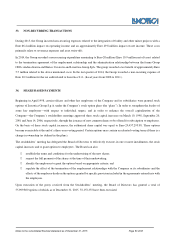
Notes to the consolidated financial statement as of December 31, 2015 Page 61 di 68
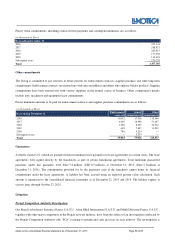
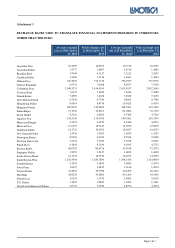
A summary of related party transactions as of December 31, 2015 and 2014 is provided below.
(in thousands of Euro)
As of December 31, 2015 Consolidated Statement
of Income
Consolidated Statement
of Financial Position
Related parties Revenues
Costs
Assets
Liabilities
Brooks Brothers Group, Inc. 416
768
29
336
Eyebiz Laboratories Pty Limited 5,563
53,104
10,682
16,358
Salmoiraghi & Viganò 16,848
1
56,361
517
Others 2,457
8,947
10,384
552
Total 25,285
62,820
77,456
17,763
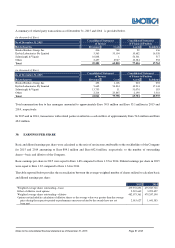
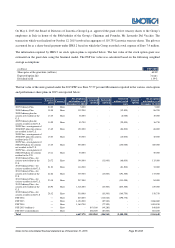
(in thousands of Euro)
As of December 31, 2015 Consolidated Statement
of Income
Consolidated Statement
of Financial Position
Related parties Revenues
Costs
Assets
Liabilities
Brooks Brothers Group, Inc. 452
1,108
202
292
Eyebiz Laboratories Pty Limited 5,642
54,834
10,233
17,144
Salmoiraghi & Viganò 13,753
11
51,076
183
Others 2,214
23,845
2,190
3,318
Total 22,061
79,798
63,701
20,937
Total remuneration due to key managers amounted to approximately Euro 50.8 million and Euro 53.1 million in 2015 and
2014, respectively.
In 2015 and in 2014, transactions with related parties resulted in a cash outflow of approximately Euro 54.6 million and Euro
48.2 million.
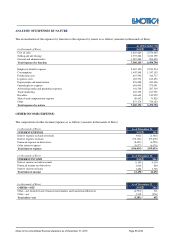
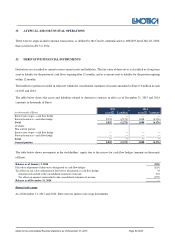
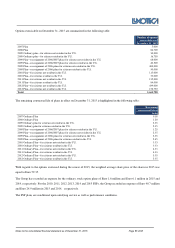
30. EARNINGS PER SHARE
Basic and diluted earnings per share were calculated as the ratio of net income attributable to the stockholders of the Company
for 2015 and 2014 amounting to Euro 804.1 million and Euro 642.6 million, respectively, to the number of outstanding
shares—basic and dilutive of the Company.
Basic earnings per share in 2015 were equal to Euro 1.68 compared to Euro 1.35 in 2014. Diluted earnings per share in 2015
were equal to Euro 1.67 compared to Euro 1.34 in 2014.
The table reported below provides the reconciliation between the average weighted number of shares utilized to calculate basic
and diluted earnings per share:
2015
2014
Weighted average shares outstanding—basic 479,553,693
475,947,763
Effect of dilutive stock options 2,519,669
3,299,427
Weighted average shares outstanding—dilutive 482,073,361
479,247,190
Options not included in calculation of dilutive shares as the average value was greater than the average
price during the respective period or performance measures related to the awards have not yet
been
met
2,015,627
1,641,383