LensCrafters 2015 Annual Report Download - page 211
Download and view the complete annual report
Please find page 211 of the 2015 LensCrafters annual report below. You can navigate through the pages in the report by either clicking on the pages listed below, or by using the keyword search tool below to find specific information within the annual report.-
 1
1 -
2
-
3
-
4
-
5
-
6
-
7
-
8
-
9
-
10
-
11
-
12
-
13
-
14
-
15
-
16
-
17
-
18
-
19
-
20
-
21
-
22
-
23
-
24
-
25
-
26
-
27
-
28
-
29
-
30
-
31
-
32
-
33
-
34
-
35
-
36
-
37
-
38
-
39
-
40
-
41
-
42
-
43
-
44
-
45
-
46
-
47
-
48
-
49
-
50
-
51
-
52
-
53
-
54
-
55
-
56
-
57
-
58
-
59
-
60
-
61
-
62
-
63
-
64
-
65
-
66
-
67
-
68
-
69
-
70
-
71
-
72
-
73
-
74
-
75
-
76
-
77
-
78
-
79
-
80
-
81
-
82
-
83
-
84
-
85
-
86
-
87
-
88
-
89
-
90
-
91
-
92
-
93
-
94
-
95
-
96
-
97
-
98
-
99
-
100
-
101
-
102
-
103
-
104
-
105
-
106
-
107
-
108
-
109
-
110
-
111
-
112
-
113
-
114
-
115
-
116
-
117
-
118
-
119
-
120
-
121
-
122
-
123
-
124
-
125
-
126
-
127
-
128
-
129
-
130
-
131
-
132
-
133
-
134
-
135
-
136
-
137
-
138
-
139
-
140
-
141
-
142
-
143
-
144
-
145
-
146
-
147
-
148
-
149
-
150
-
151
-
152
-
153
-
154
-
155
-
156
-
157
-
158
-
159
-
160
-
161
-
162
-
163
-
164
-
165
-
166
-
167
-
168
-
169
-
170
-
171
-
172
-
173
-
174
-
175
-
176
-
177
-
178
-
179
-
180
-
181
-
182
-
183
-
184
-
185
-
186
-
187
-
188
-
189
-
190
-
191
-
192
-
193
-
194
-
195
-
196
-
197
-
198
-
199
-
200
-
 201
201 -
 202
202 -
 203
203 -
 204
204 -
 205
205 -
 206
206 -
 207
207 -
 208
208 -
 209
209 -
 210
210 -
 211
211 -
 212
212 -
 213
213 -
 214
214 -
 215
215 -
 216
216 -
 217
217 -
 218
218 -
 219
219 -
 220
220 -
 221
221 -
222
-
223
-
224
-
225
-
226
-
227
-
228
-
229
-
230
-
231
-
232
-
233
-
234
-
235
-
236
-
237
-
238
-
239
-
240
-
241
-
242
-
243
-
244
-
245
-
246
-
247
-
248
-
249
-
250
-
251
-
252
-
253
-
254
-
255
-
256
-
257
-
258
-
259
-
260
-
261
-
262
-
263
-
264
-
265
-
266
-
267
-
268
-
269
-
270
 |
 |

Notes to the separate financial statements as of December 31, 2015 Page 31 of 77
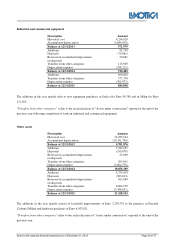
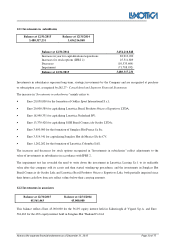
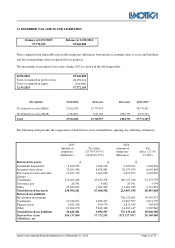
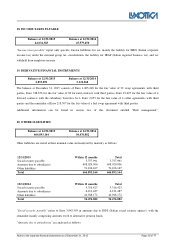
13. DEFERRED TAX ASSETS AND LIABILITIES
Balance at 12/31/2015 Balance at 12/31/2014
57,772,185 29,546,880
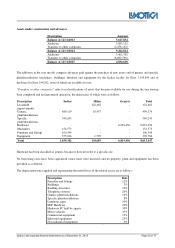
These originate from deductible and taxable temporary differences between the accounting value of assets and liabilities
and the corresponding value recognized for tax purposes.
The movements in net deferred tax assets during 2015 are shown in the following tables:
Description 12/31/2014
Increases
Decreases
12/31/2015
Net deferred tax assets (IRES) 23,001,989
25,776,493
-
48,778,482
Net deferred tax assets (IRAP) 6,544,891
3,533,604
1,084,792
8,993,703
Total 29,546,880
29,310,097
1,084,792
57,772,185
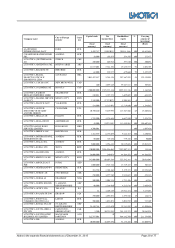
The following table presents the composition of deferred tax assets and liabilities, ignoring any offsetting of balances:
2015 2014
Amount of
temporary
differences
Tax effect
(27.50-33.07%)
(24.00-29.57%)
Amount of
temporary
differences
Tax
effect (27.50-
31.40%)
Deferred tax assets:
Trademark impairment 5,499,553
1,626,218
6,059,013
1,902,530
Inventory write-down 32,105,386
8,828,981
29,257,474
8,045,805
Provisions for risks and other
charges
13,031,719
4,309,589
8,453,973
2,648,067
Trademarks 154,462,208
45,674,476
166,155,348
52,172,779
Severance pay 20,341
4,882
20,341
5,594
Other 25,845,034
7,022,436
13,461,289
3,712,893
Total deferred tax assets 230,964,241
67,466,582
223,407,438
68,487,668
Deferred tax liabilities:
Revaluation investments -
-
708,132,663
30,459,373
Trademarks 11,526,673
3,408,437
12,967,507
4,071,797
Finance leases 1,831,558
439,574
1,831,558
503,678
Other 21,268,150
5,846,386
14,203,417
3,905,940
Total deferred tax liabilities
34,626,381
9,694,397
737,135,145
38,940,788
Deferred tax assets
(liabilities), net
196,337,860
57,772,185
(513,727,707)
29,546,880
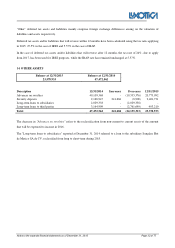
01/01/2015 29,546,880
Taxes recognized in profit or loss 28,359,914
Taxes recognized in equity (134,609)
12/31/2015 57,772,185