LensCrafters 2015 Annual Report Download - page 178
Download and view the complete annual report
Please find page 178 of the 2015 LensCrafters annual report below. You can navigate through the pages in the report by either clicking on the pages listed below, or by using the keyword search tool below to find specific information within the annual report.-
 1
1 -
2
-
3
-
4
-
5
-
6
-
7
-
8
-
9
-
10
-
11
-
12
-
13
-
14
-
15
-
16
-
17
-
18
-
19
-
20
-
21
-
22
-
23
-
24
-
25
-
26
-
27
-
28
-
29
-
30
-
31
-
32
-
33
-
34
-
35
-
36
-
37
-
38
-
39
-
40
-
41
-
42
-
43
-
44
-
45
-
46
-
47
-
48
-
49
-
50
-
51
-
52
-
53
-
54
-
55
-
56
-
57
-
58
-
59
-
60
-
61
-
62
-
63
-
64
-
65
-
66
-
67
-
68
-
69
-
70
-
71
-
72
-
73
-
74
-
75
-
76
-
77
-
78
-
79
-
80
-
81
-
82
-
83
-
84
-
85
-
86
-
87
-
88
-
89
-
90
-
91
-
92
-
93
-
94
-
95
-
96
-
97
-
98
-
99
-
100
-
101
-
102
-
103
-
104
-
105
-
106
-
107
-
108
-
109
-
110
-
111
-
112
-
113
-
114
-
115
-
116
-
117
-
118
-
119
-
120
-
121
-
122
-
123
-
124
-
125
-
126
-
127
-
128
-
129
-
130
-
131
-
132
-
133
-
134
-
135
-
136
-
137
-
138
-
139
-
140
-
141
-
142
-
143
-
144
-
145
-
146
-
147
-
148
-
149
-
150
-
151
-
152
-
153
-
154
-
155
-
156
-
157
-
158
-
159
-
160
-
161
-
162
-
163
-
164
-
165
-
166
-
167
-
 168
168 -
 169
169 -
 170
170 -
 171
171 -
 172
172 -
 173
173 -
 174
174 -
 175
175 -
 176
176 -
 177
177 -
 178
178 -
 179
179 -
 180
180 -
 181
181 -
 182
182 -
 183
183 -
 184
184 -
 185
185 -
 186
186 -
 187
187 -
 188
188 -
189
-
190
-
191
-
192
-
193
-
194
-
195
-
196
-
197
-
198
-
199
-
200
-
201
-
202
-
203
-
204
-
205
-
206
-
207
-
208
-
209
-
210
-
211
-
212
-
213
-
214
-
215
-
216
-
217
-
218
-
219
-
220
-
221
-
222
-
223
-
224
-
225
-
226
-
227
-
228
-
229
-
230
-
231
-
232
-
233
-
234
-
235
-
236
-
237
-
238
-
239
-
240
-
241
-
242
-
243
-
244
-
245
-
246
-
247
-
248
-
249
-
250
-
251
-
252
-
253
-
254
-
255
-
256
-
257
-
258
-
259
-
260
-
261
-
262
-
263
-
264
-
265
-
266
-
267
-
268
-
269
-
270
 |
 |

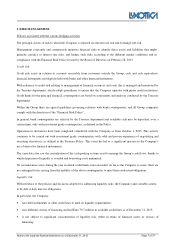
Separate financial statements as of December 31, 2015 Page 7 of 8
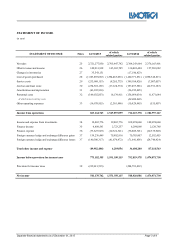
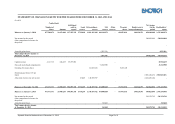
STATEMENT OF CASH FLOWS
(in euro) Notes
12/31/2015
of which
related
parties
12/31/2014
of which
related
parties
Income before provision for income taxes,
net of dividend income
681,527,647
1,531,484,339
644,744,918
1,365,997,070
Stock-based compensation 32
24,226,842
-
13,416,589
-
Amortization, depreciation and impairment 31
135,181,870
-
56,952,405
-
Finance expense 36
63,269,506
4,654,815
65,989,603
9,747,420
Finance income 35
(3,065,380)
(1,018,109)
(6,338,676)
(2,129,779)
Changes in accounts receivable 5
133,397,126
133,594,348
(74,228,786)
(72,617,718)
Changes in accounts payable 17
67,349,554
50,702,146
41,818,616
7,960,176
Changes in other assets/liabilities
53,787,034
16,387,615
61,888,880
5,642,342
Changes in inventories 6
(35,543,153)
-
17,180,826
-
Total non-cash adjustments
438,603,399
204,320,815
176,679,457
(51,397,559)
Interest paid
(61,720,267)
(3,393,923)
(54,296,762)
(9,747,420)
Interest received
2,923,942
668,745
5,727,202
2,129,779
Taxes paid
(275,091,837)
-
(185,841,080)
-
Dividend income 34
91,654,708
91,654,708
108,074,660
108,074,660
Total cash adjustments
(242,233,454)
88,929,530
(126,335,980)
100,457,019
A Cash generated from operating activities
877,897,592
1,824,734,684
695,088,395
1,415,056,530
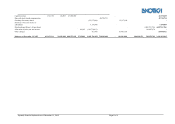
(Purchase)/disposal of property, plant and equipment
§ Purchase 10
(11,666,534)
-
(14,110,915)
-
§ Disposal 10
146,064
-
120,966
-
(Purchase)/disposal of intangible assets
§ Purchase 11
(36,776,383)
-
(36,135,955)
-
§ Disposal 11
2,772,834
-
3,048,354
-
Changes in investments in subsidiaries
§ Increase 12
(83,474,493)
(83,474,493)
(243,909,104)
(243,909,104)
§ Liquidation 12
5,248,727
5,248,727
8,726,360
8,726,360
Dividends paid 24
(689,713,756)
-
(308,343,023)
-
B Cash used in investing activities
(813,463,541)
(78,225,766)
(590,603,317)
(235,182,744)
Long-term debt
§ Proceeds 21
23,861,699
-
510,492,308
§ Repayments 21
(527,373,036)
(27,211,725)
(324,083,643)
(24,078,305)
Long-term loans given
§ Disbursements 14
-
-
(2,547,273)
(2,029,338)
§ Repayments
2,761,699
-
-
-
Changing in cash pooling payable and receivable 9/20
221,245,054
221,245,054
(104,819,676)
(104,819,676)
Capital increase 24
47,679,295
-
69,986,635
-
C Cash generated from/(used in) financing activities
(231,825,289)
194,033,329
149,028,351
(130,927,319)
D Cash and cash equivalents, beginning of period
390,571,582
-
137,058,153
-
E Total cash flow generated from/(used) in period (A+B+C)
(167,391,238)
1,940,542,247
253,513,429
1,048,946,467
Cash and cash equivalents, end of period (D+E)
223,180,344
-
390,571,582
-