JCPenney 2003 Annual Report Download - page 8
Download and view the complete annual report
Please find page 8 of the 2003 JCPenney annual report below. You can navigate through the pages in the report by either clicking on the pages listed below, or by using the keyword search tool below to find specific information within the annual report.-
 1
1 -
 2
2 -
 3
3 -
 4
4 -
 5
5 -
 6
6 -
 7
7 -
 8
8 -
 9
9 -
 10
10 -
 11
11 -
 12
12 -
 13
13 -
 14
14 -
 15
15 -
 16
16 -
 17
17 -
 18
18 -
 19
19 -
20
-
21
-
22
-
23
-
24
-
25
-
26
-
27
-
28
-
29
-
30
-
31
-
32
-
33
-
34
-
35
-
36
-
37
-
38
-
39
-
40
-
41
-
42
-
43
-
44
-
45
-
46
-
47
-
48
-
49
-
50
-
51
-
52
 |
 |

J. C. Penney Company, Inc.6
MANAGEMENT’S DISCUSSION AND
ANALYSIS OF FINANCIAL CONDITION
AND RESULTS OF OPERATIONS
The following discussion should be read in conjunction with a
discussion of Eckerd, Mexico department stores and Direct
Marketing Services discontinued operations beginning on page
10, an explanation of the Company’s critical accounting policies
beginning on page 7, the accompanying consolidated financial
statements and notes thereto beginning on page 22, along with
the unaudited Five-Year Financial Summary on page 43.
CORPORATE GOVERNANCE AND FINANCIAL REPORTING
Corporate governance and financial reporting have received
considerable attention over the past several years. Because of
JCPenney’s strong heritage in this area, many of the requirements
of new regulations enacted in 2003 and 2002 were already main-
stays of the way the Company does business. Moreover, man-
agement has enhanced the Company’s well-established pro-
grams and policies to ensure continued compliance with the
highest levels of corporate governance. For example, manage-
ment developed a reporting matrix that requires written certifi-
cations from a cross-discipline team of key members of manage-
ment who have the greatest responsibility for verifying and
reporting corporate results.
The Company also has a long history of integrity in financial
reporting and remains committed to increasing the transparency
to provide shareholders with a balanced view of the Company’s
financial position and operating results. Significant enhance-
ments were made and additional pages were included in last
year’s Annual Report, with additional disclosures in the areas of
strategic initiatives and financial goals, pension accounting and
funding, stock option accounting, and forward-looking informa-
tion related to operating results, cash flow and financing. This
2003 Annual Report continues the trend with the addition of an
executive overview, discussion of corporate governance prac-
tices, risk management processes and additional pension
disclosures. Management believes that the Company has made
further progress toward the overall goal of transparency and
informative financial disclosures and reporting.
EXECUTIVE OVERVIEW
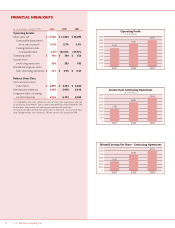
2003 Accomplishments
Increased comparable store sales — Comparable depart-
ment store sales increased 0.9% in 2003, representing the third
consecutive year of improvement.
Achieved Catalog/Internet sales growth — Catalog/Internet
sales increased 3.3% in 2003 after two years of significant sales
declines. Internet sales continue to experience strong growth,
increasing by 50.8% in 2003.
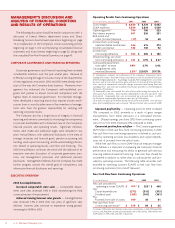
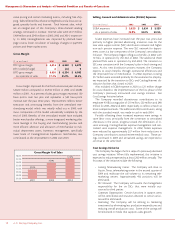
Operating Results from Continuing Operations
($ in millions, except EPS) 2003 2002 2001
Gross margin $6,620 $6,334 $ 6,082
SG&A expenses 5,830 5,634 5,529
Operating profit(1) 790 700 553
Net interest expense 261 226 231
Real estate and
other (income)/expense (17) 59 48
Income from continuing
operations before income taxes 546 415 274
Income tax expense 182 130 92
Income from
continuing operations $364 $285 $ 182
Diluted earnings per share
from continuing operations $1.21 $0.95 $ 0.57
Comparable department
store sales(2) increase 0.9% 2.7% 3.4%
Catalog/Internet sales
increase/(decrease) 3.3%(3) (22.0)% (19.7)%
(1) Management evaluates the performance of the Company’s Department Stores,
Catalog and Internet based on revenues and expenses that are considered to be part
of normal ongoing operations. Accordingly, excluded from management’s assessment
are items such as real estate activities, gains and losses on the sale of real estate prop-
erties, and asset impairments and other charges associated with closing Store and
Catalog facilities. Such items are recorded in Real Estate and Other in the Consolidated
Statements of Operations.
(2) Comparable store sales include the sales of stores after having been open for 12
consecutive fiscal months. Stores become comparable on the first day of the 13th
fiscal month. Comparable store sales are presented on a 52-week basis. In 2003,
the 53rd week accounted for department store sales of $158 million.
(3) Includes the effect of $46 million of sales for the 53rd week of 2003. On a 52-week
basis, total Catalog/Internet sales increased 1.5% and Internet sales increased 47.8%.
Improved profitability — Operating profit for 2003 increased
13% compared to 2002, primarily as a result of gross margin
improvements from better execution in a centralized environ-
ment. Diluted earnings per share (EPS) from continuing opera-
tions of $1.21 for 2003 improved 27% compared to 2002.
Generated positive free cash flow — The Company generated
$379 million of free cash flow from continuing operations in 2003.
Free cash flow from continuing operations is defined as cash pro-
vided by operating activities less dividends and capital expendi-
tures, net of proceeds from the sale of assets.
While free cash flow is a non-GAAP financial measure, manage-
ment believes it is important in evaluating the Company’s financial
performance and measuring the ability to generate cash without
incurring additional external financing. Free cash flow should be
considered in addition to, rather than as a substitute for, cash pro-
vided by operating activities. The following table reconciles cash
provided by operating activities (GAAP) to free cash flow from
continuing operations (non-GAAP measure):
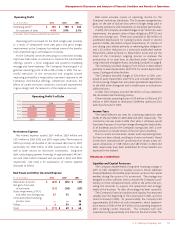
Free Cash Flow from Continuing Operations
($ in millions) 2003 2002 2001
Net cash provided by
operating activities (GAAP) $812(1) $522(1) $440
Less:
Capital expenditures (373) (315) (315)
Dividends paid (160) (161) (161)
Plus:
Proceeds from sale of assets 100 38 61
Free cash flow from
continuing operations(2) $379 $84$25
(1) Includes $300 million discretionary cash pension contributions in both 2003 and 2002.
(2) Free cash flow from discontinued operations was $(48) million, $464 million and
$189 million in 2003, 2002 and 2001, respectively.