JCPenney 2003 Annual Report Download - page 15
Download and view the complete annual report
Please find page 15 of the 2003 JCPenney annual report below. You can navigate through the pages in the report by either clicking on the pages listed below, or by using the keyword search tool below to find specific information within the annual report.-
 1
1 -
2
-
3
-
4
-
 5
5 -
 6
6 -
 7
7 -
 8
8 -
 9
9 -
 10
10 -
 11
11 -
 12
12 -
 13
13 -
 14
14 -
 15
15 -
 16
16 -
 17
17 -
 18
18 -
 19
19 -
 20
20 -
 21
21 -
 22
22 -
 23
23 -
 24
24 -
 25
25 -
26
-
27
-
28
-
29
-
30
-
31
-
32
-
33
-
34
-
35
-
36
-
37
-
38
-
39
-
40
-
41
-
42
-
43
-
44
-
45
-
46
-
47
-
48
-
49
-
50
-
51
-
52
 |
 |

J. C. Penney Company, Inc. 13
Management’s Discussion and Analysis of Financial Condition and Results of Operations
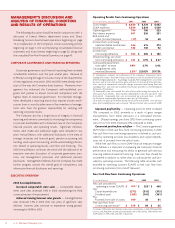
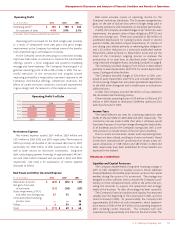
Operating Profit
($ in millions) 2003 2002 2001
Operating profit(1) $790 $700 $ 553
As a percent of sales 4.4% 3.9% 3.1%
(1) Excludes Interest Expense and Real Estate and Other.
Operating profit increased for the third straight year, primarily
as a result of comparable store sales gains and gross margin
improvement as the Company has realized some of the benefits
from implementing its centralization initiatives.
As the Company continues executing its turnaround strategy,
steps have been taken to continue to improve the merchandise
offerings, present a more integrated and powerful marketing
message and lower expenses. The Company’s financial goal is to
generate operating profit of 6% to 8% of sales in 2005. The suc-
cessful execution of the turnaround and progress toward
improving profitability is impacted by customers’ response to the
Company’s merchandise offerings, competitive conditions, the
effects of current economic conditions, continued improvement
in gross margin and the reduction of the expense structure.
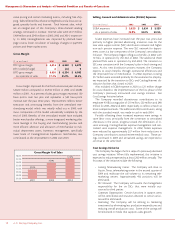
Net Interest Expense
Net interest expense totaled $261 million, $226 million and
$231 million in 2003, 2002 and 2001, respectively. The increase in
2003 is primarily attributable to the increased debt level in 2003,
particularly the $600 million of debt issued early in the year, as
well as lower returns on short-term investments. Long-term
debt, excluding equipment financing, of approximately $442 mil-
lion and $920 million matured and was paid in 2003 and 2002,
respectively. See Note 2 for explanation of interest expense
allocated to Eckerd.
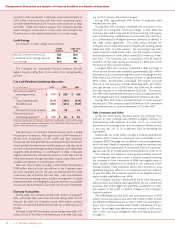
Real Estate and Other (Income)/Expense
($ in millions) 2003 2002 2001
Real estate activities $(28) $(25) $ (31)
Net gains from sale
of real estate (51) (16) (57)
Asset impairments, PVOL
and other unit closing costs 57 75 70
Centralized merchandising
process costs ——36
Other 525 30
Tot al $(17) $59$48
Real estate activities consist of operating income for the
Company’s real estate subsidiaries. The Company recognized net
gains on the sale of facilities that were no longer being used in
Company operations and investments in real estate partnerships.
In 2003, the Company recorded charges of $57 million for asset
impairments, the present value of lease obligations (PVOL) and
other unit closing costs. These costs consisted of $22 million of
accelerated depreciation for Catalog facilities closed in second
quarter of 2003, $26 million of asset impairments, $11 million of
unit closing costs related primarily to remaining lease obligations
and a $2 million reduction to a previously established reserve.
Impairments relate primarily to department stores and are the
result of the Company’s ongoing process to evaluate the
productivity of its asset base, as described under Valuation of
Long-Lived and Intangible Assets, Including Goodwill on page 8.
The Company recorded charges of $75 million in 2002 related
primarily to asset impairments and PVOL for certain department
stores, Catalog and other facilities.
The Company recorded charges of $70 million in 2001, com-
prised of asset impairments and PVOL, and included $28 million
of restructuring charges that principally represented adjustments
to the 2000 store closing plan and a modification to include two
additional units.
In 2001 the Company incurred $36 million of costs related to
the centralized merchandising process.
Other includes operating losses of $10 million in 2002 and $19
million in 2001 related to third-party fulfillment operations that
were discontinued in 2002.
Income Taxes
The overall effective tax rates for continuing operations were
33.2%, 31.5% and 33.4% for 2003, 2002 and 2001, respectively. The
income tax rate was lower in 2002 than what it otherwise would
have been because of a tax law change allowing the deductibility
of all dividends paid to the Company’s savings plan, with a one-
time provision to include certain of the prior year’s dividends.
Due to current income levels, certain state tax planning bene-
fits have not been utilized, resulting in a lower tax benefit. Based
on the short time periods for carryforwards in certain states, val-
uation allowances of $108 million and $80 million in 2003 and
2002, respectively, have been established for those benefits not
expected to be realized.
FINANCIAL CONDITION
Liquidity and Capital Resources
The Company implemented a long-term financing strategy in
2001 to help strengthen its liquidity position, ensure adequate
financial flexibility and enable opportunistic access to the capital
markets during the course of its turnaround. The strategy was
designed to allow sufficient time to restore the Company’s prof-
itability to more competitive levels, while at the same time pro-
viding the resources to support the operational and strategic
needs of the business. To date, this strategy has been successful.
The Company’s financial condition and liquidity has improved
steadily since the beginning of the turnaround in 2001, and that
trend continued in 2003. At year-end 2003, the Company had
approximately $3.0 billion of cash investments, which represent-
ed in excess of 55% of the $5.4 billion of outstanding long-term
debt, including current maturities. This compares with cash
investments of approximately $2.5 billion at the end of 2002. The
Operating Profit % of Sales
5.0%
4.0%
3.0%
2.0%
1.0%
0.0%
3.1%
3.9%
4.4%
2001 2002 2003