JCPenney 2003 Annual Report Download - page 39
Download and view the complete annual report
Please find page 39 of the 2003 JCPenney annual report below. You can navigate through the pages in the report by either clicking on the pages listed below, or by using the keyword search tool below to find specific information within the annual report.-
 1
1 -
2
-
3
-
4
-
5
-
6
-
7
-
8
-
9
-
10
-
11
-
12
-
13
-
14
-
15
-
16
-
17
-
18
-
19
-
20
-
21
-
22
-
23
-
24
-
25
-
26
-
27
-
28
-
 29
29 -
 30
30 -
 31
31 -
 32
32 -
 33
33 -
 34
34 -
 35
35 -
 36
36 -
 37
37 -
 38
38 -
 39
39 -
 40
40 -
 41
41 -
 42
42 -
 43
43 -
 44
44 -
 45
45 -
 46
46 -
 47
47 -
 48
48 -
 49
49 -
50
-
51
-
52
 |
 |

J. C. Penney Company, Inc. 37
Notes to the Consolidated Financial Statements
pay considered in the calculation of benefits. The Supplemental
Retirement Plan also offers participants who leave the Company
between ages 60 and 62 benefits equal to the estimated social
security benefits payable at age 62. Participation in this plan is
limited to associates who were profit-sharing management asso-
ciates at the end of 1995. The Voluntary Early Retirement
Program was offered in 1997 to management associates who
were at least age 55 with a minimum of 10 years of service and
who elected to take early retirement. These plans were amended
in December 2003 to provide participants a one-time irrevocable
election to receive remaining unpaid benefits over a five-year
period in equal annual installments. The Company is in the
process of implementing this change, which may increase the
Company’s annual cash obligations in 2004 depending on partic-
ipant elections. Several other smaller plans and agreements are
also included.
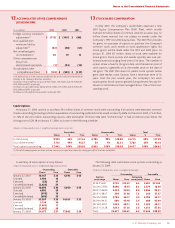
Expense for Defined Benefit Retirement Plans —Expense is
based upon the annual service cost of benefits (the actuarial cost
of benefits attributed to a period) and the interest cost on plan
liabilities, less the expected return on plan assets for the primary
pension plan. Differences in actual experience in relation to
assumptions are not recognized immediately, but are deferred
and amortized over the average remaining service period. The
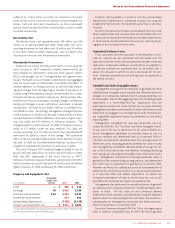
components of net periodic pension expense were as follows:
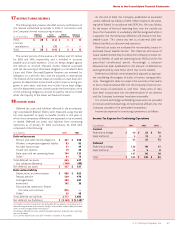
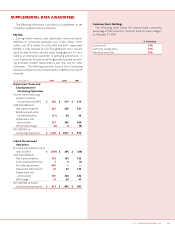
Primary Pension Plan Expense/(Income)
($ in millions) 2003 2002 2001
Service costs $75$71$83
Interest costs 195 187 183
Projected return on assets (249) (274) (337)
Net amortization 109 40 6
Curtailment gain ——11
Net periodic pension
plan expense/(income) $130 $24$ (76)
Supplemental Plans Expense
($ in millions) 2003 2002 2001
Service costs $3$2$3
Interest costs 23 19 21
Net amortization 896
Net supplemental
plans expense $34$30$30
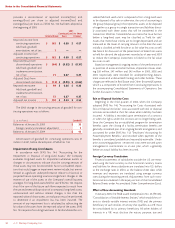
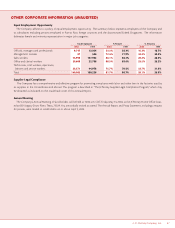
Assumptions – The weighted average actuarial assumptions used
to determine expense for 2003, 2002 and 2001 were as follows:
2003 2002 2001
Discount rate 7.10% 7.25% 7.75%
Expected return on
plan assets 8.9% 9.5% 9.5%
Salary increase 4.0% 4.0% 4.0%
The discount rate used to measure pension expense each year
is the rate as of the beginning of the year (i.e., the prior measure-
ment date). The discount rate is based on a portfolio of high qual-
ity corporate bonds with similar average cash flow durations to
the pension liability. The rate as of the end of 2003, which will be
used to measure 2004 pension expense, was reduced to 6.35%. The
expected return on plan assets is based on the plan’s long-term
asset allocation policy, historical returns for plan assets and overall
capital markets, taking into account current and expected market
conditions. The actual one-year return on pension plan assets was
approximately 19.5% in 2003, compared to a 6.7% loss in 2002.
Given lower asset returns over the past few years and lower
expected future returns, the Company lowered the expected rate
of return on plan assets from 9.5% to 8.9% as of October 31, 2002,
which was used to develop the pension expense for 2003. The
combination of assumption changes and poor investment returns
in 2002 and 2001 resulted in an increase in 2003 pension expense
of $106 million. The Company used 9.5% to develop the 2002
pension expense, which was the expected rate of return as of
October 31, 2001.
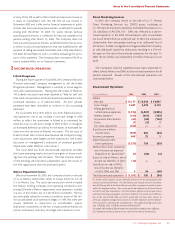
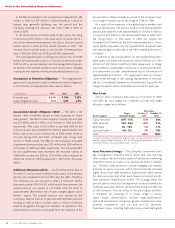
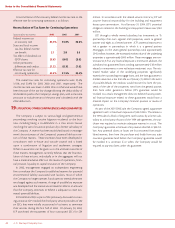
Funded Status – The table below provides a reconciliation of
benefit obligations, plan assets and the funded status of the
defined benefit pension and supplemental retirement plans. The
projected benefit obligation (PBO) is the present value of bene-
fits earned to date by plan participants, including the effect of
assumed future salary increases. Assets used in calculating the
funded status are measured at the fair value at October 31 (the
plan’s measurement date).
Assets and Obligations
Pension Plans Supplemental Plans
($ in millions) 2003 2002 2003 2002
Change in PBO
Beginning of year $2,839 $2,672 $339 $305
Service and
interest costs 270 258 26 21
Actuarial loss 379 89 67 40
Benefits (paid)(1) (186) (180) (27) (27)
End of year $3,302 $2,839 $405 $339
Change in fair
value of plan
assets
Beginning of year $2,886 $2,977 $—$—
Company
contributions 300 300 27 27
Actual return
on assets 523 (211) ——
Benefits (paid)(1) (186) (180) (27) (27)
End of year $3,523 $2,886 $—$—
Funded status
of plan
Excess of fair value
over projected
benefits $221 $47$(405) $(339)
Unrecognized
losses and prior
service cost 1,099 1,103 177 116
Prepaid pension
cost/(accrued
liability) $1,320 $1,150 $(228) $(223)
(1) Does not include plan administrative expenses.