JCPenney 2003 Annual Report Download - page 16
Download and view the complete annual report
Please find page 16 of the 2003 JCPenney annual report below. You can navigate through the pages in the report by either clicking on the pages listed below, or by using the keyword search tool below to find specific information within the annual report.-
 1
1 -
2
-
3
-
4
-
5
-
 6
6 -
 7
7 -
 8
8 -
 9
9 -
 10
10 -
 11
11 -
 12
12 -
 13
13 -
 14
14 -
 15
15 -
 16
16 -
 17
17 -
 18
18 -
 19
19 -
 20
20 -
 21
21 -
 22
22 -
 23
23 -
 24
24 -
 25
25 -
 26
26 -
27
-
28
-
29
-
30
-
31
-
32
-
33
-
34
-
35
-
36
-
37
-
38
-
39
-
40
-
41
-
42
-
43
-
44
-
45
-
46
-
47
-
48
-
49
-
50
-
51
-
52
 |
 |

J. C. Penney Company, Inc.14
Management’s Discussion and Analysis of Financial Condition and Results of Operations
increase in cash investments in 2003 was comprised principally of
$379 million of positive free cash flow from continuing opera-
tions (see table below) and $157 million of net additions to long-
term debt. These cash balances support the Company’s liquidity
needs during its turnaround, at a time when the Company has
limited access to the capital markets due to its credit ratings.
Credit Ratings
As of March 16, 2004, ratings were as follows:
Senior Long-term
Implied Debt
Moody’s Investors Service, Inc. Ba2 Ba3
Standard & Poor’s Ratings Services BB+ BB+
Fitch Ratings N/A BB
The Company has maintained Moody’s Investors Service’s
highest liquidity rating (SGL-1) as a result of its strong liquidity
position.
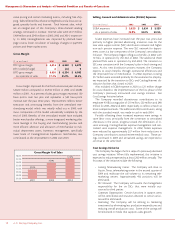
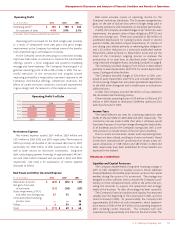
Free Cash Flow from Continuing Operations
($ in millions) 2003 2002 2001
Net cash provided by
operating activities $812(1) $522(1) $440
Less:
Capital expenditures (373) (315) (315)
Dividends paid (160) (161) (161)
Plus:
Proceeds from sale of assets 100 38 61
Free cash flow from
continuing operations(2) $379 $84$25
(1) Includes $300 million discretionary cash pension contributions in both 2003 and 2002.
(2) Free cash flow from discontinued operations was $(48) million, $464 million and $189
million in 2003, 2002 and 2001, respectively.
Free cash flow is an important financial measure, which is widely
focused upon by investors. Although it is not a GAAP measure, it is
derived from components of the GAAP cash flow statement.
Positive free cash flow generated by a company indicates the amount
of cash available for reinvestment in the business, or cash that can be
returned to investors through increased dividends, stock repurchase
programs, debt retirements, or a combination of these. Conversely,
negative free cash flow indicates the amount of cash that must be
raised from investors through new debt or equity issues, reduction in
available cash balances, or a combination of these.
Free cash flow in 2003, including a $300 million discretionary
($190 million after tax) cash contribution to the Company’s pen-
sion plan, exceeded plan for the year and represented the fourth
consecutive year of positive free cash flow. Cash flow benefited
from improved operating results, prudent management of capital
expenditures after a challenging first quarter, and accounts payable
and accrued expense benefits associated with this year’s 53rd week.
Financing Transactions
During 2003, the Company retired $442 million of long-term
debt, principally debt issues that matured during 2003, and on
February 28, 2003, the Company issued $600 million principal
amount of unsecured 8.0% Notes Due 2010 at an effective rate of
8.125%.
Included in the 2003 retirements above are approximately $117
million of the $119 million 6.9% Debentures Due 2026 that were
put to the Company and retired in August.
During 2002, approximately $920 million of long-term debt
matured and was paid.
During 2002, the Company completed two transactions that
were part of its long-term financing strategy. In May 2002, the
Company executed a three-year $1.5 billion revolving credit agree-
ment (credit facility). Indebtedness incurred under the credit facil-
ity is collateralized by all eligible domestic inventory, as defined in
the credit facility agreement. This credit facility provides the
Company with an additional source of liquidity for working capital
needs and letter of credit support. No borrowings have been
made under this credit facility, other than the issuance of import
and standby letters of credit, which totaled $227 million as of year-
end 2003. The Company was in compliance with all financial
covenants of the credit facility as of January 31, 2004. See further
discussion of these covenants below.
In August 2002, the Company completed a debt exchange in
which certain bondholders tendered approximately $227 million
principal amount of three existing debt issues in exchange for new
9.0% Notes Due 2012 with a principal amount of approximately
$230 million. Bondholders exchanged $79 million principal
amount of the Company’s 6.125% Notes Due 2003, $67 million
principal amount of its 7.375% Notes Due 2004 and $81 million
principal amount of its 6.9% Debentures Due 2026. This transac-
tion effectively extended the maturity on amounts represented by
the exchanged notes and strengthened the Company’s liquidity.
During 2001, $250 million principal amount of notes matured
and was paid. The Company issued $650 million of 5% convertible
subordinated notes in a private placement in October 2001.
Debt Covenants and Other
Under the credit facility discussed above, the Company must
maintain an asset coverage ratio, defined as eligible inventory to
total revolving credit exposure, of at least 1.75 to 1.0. Given that
there were no borrowings other than the issuance of letters of cred-
it, this ratio was 14.1 to 1.0 at year-end 2003, far exceeding the
requirement.
Additionally, the credit facility includes a financial performance
covenant, which consists of a maximum ratio of total debt to con-
solidated EBITDA (leverage ratio, as defined in the credit agreement,
which includes Eckerd) as measured on a trailing four-quarters basis,
calculated at each quarter end. As of year-end 2003, the actual lever-
age ratio was 3.31 to 1.0, well within the prescribed limit of 4.25 to 1.0.
The Company has indentures covering approximately $755 mil-
lion of long-term debt that contain a financial covenant requiring
the Company to have a minimum of 200% net tangible assets to
senior funded indebtedness (as defined in the indenture, which
includes Eckerd). These indentures permit the Company to issue
additional long-term debt if it is in compliance with the covenant.
At year-end 2003, the Company’s percent of net tangible assets to
senior funded indebtedness was 245%.
The Company’s liquidity is enhanced by the fact that the current
debt portfolio and material lease agreements do not contain any
provisions that could trigger early payments, acceleration or collat-
eral support in the event of adverse changes in the Company’s
financial condition.
The 7.4% Debentures Due 2037, with a principal amount of $400
million, contain put options that allow the investor to elect to have
the debenture redeemed at par on April 1, 2005. For planning pur-
poses, the Company assumes these holders will exercise the put
option. Accordingly, these debentures are included as 2005 matu-
rities in the Contractual Obligations table and related discussion
on page 15.