JCPenney 2003 Annual Report Download - page 13
Download and view the complete annual report
Please find page 13 of the 2003 JCPenney annual report below. You can navigate through the pages in the report by either clicking on the pages listed below, or by using the keyword search tool below to find specific information within the annual report.-
 1
1 -
2
-
 3
3 -
 4
4 -
 5
5 -
 6
6 -
 7
7 -
 8
8 -
 9
9 -
 10
10 -
 11
11 -
 12
12 -
 13
13 -
 14
14 -
 15
15 -
 16
16 -
 17
17 -
 18
18 -
 19
19 -
 20
20 -
 21
21 -
 22
22 -
 23
23 -
24
-
25
-
26
-
27
-
28
-
29
-
30
-
31
-
32
-
33
-
34
-
35
-
36
-
37
-
38
-
39
-
40
-
41
-
42
-
43
-
44
-
45
-
46
-
47
-
48
-
49
-
50
-
51
-
52
 |
 |

J. C. Penney Company, Inc. 11
Management’s Discussion and Analysis of Financial Condition and Results of Operations
largely tax-free transactions. See further discussion of manage-
ment’s evaluation of potential goodwill impairment under SFAS
No. 142 and an analysis of the carrying value of the Company’s
investment in Eckerd compared to the fair value less costs to sell
under SFAS No. 144, and the related tax impact, in Note 2.
The 2003 loss from discontinued operations excludes the
future operating results and any future gains or losses resulting
from the pending sale of Eckerd. The final financial impact of the
pending sale of Eckerd is dependent upon the results of the final
negotiations with the ultimate buyer(s).
Mexico Department Stores
Effective November 30, 2003, the Company closed on the sale of
its Mexico department store operation, consisting of six depart-
ment stores, to Grupo Sanborns S.A. de C.V. of Mexico City. The
stock sale transaction, which included the Mexico holding com-
pany and operating companies comprising JCPenney’s Mexico
department store operation, resulted in a loss of $14 million, net of
a $27 million tax benefit. The loss was principally related to cur-
rency translation losses of $25 million accumulated since opera-
tions began in 1995 that were previously reflected as reductions to
stockholders’ equity. Additional components of the loss include
potential liability on certain store leases, inventory shrinkage and
transaction costs.
Direct Marketing Services
In 2001, the Company closed on the sale of its J. C. Penney Direct
Marketing Services, Inc. (DMS) assets, including its J. C. Penney Life
Insurance subsidiaries and related businesses, to a U.S. subsidiary of
AEGON, N.V. DMS was reflected as a discontinued operation in
the 2000 Annual Report, with an estimated net loss of $296 million
on a planned sale. In 2001, the transaction closed earlier than antic-
ipated, resulting in an additional loss of $16 million. In 2002, tax reg-
ulation changes enabled the Company to take additional capital
loss deductions, resulting in a $34 million gain on the sale of dis-
continued operations for the year. In 2003, the tax liability was
reduced by $4 million because of a tax audit.
The Company’s financial statements, accompanying notes and
other information provided in this Annual Report reflect these
businesses as discontinued operations for all periods presented.
RESULTS OF OPERATIONS
The following discussion and analysis, consistent with all other
financial data throughout this Annual Report, focuses on the
results of operations and financial condition from the Company’s
continuing operations.
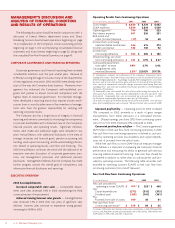
Income from Continuing Operations
The Company’s profitability improved as the turnaround con-
tinued to progress. Income from continuing operations was
$364 million, $285 million, and $182 million in 2003, 2002 and
2001, respectively. After a challenging first quarter in 2003, signif-
icant actions were taken in merchandising, marketing and
expense control. Recovery plans were put in place, and as a
result, 2003 sales and operating profits rebounded during the bal-
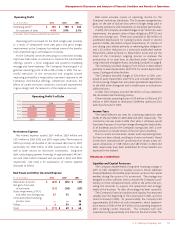
ance of the year. EPS from continuing operations in 2003
increased 27% to $1.21 compared to $0.95 last year and $0.57 in
2001, driven by improved operating profit. All references to EPS
are on a diluted basis, unless otherwise indicated.
Included in the Company’s income from continuing opera-
tions is higher incremental after-tax pension expense of about
$71 million, or $0.24 per share in 2003 and $59 million, or $0.20
per share in 2002, as discussed in Pension: Impact on Earnings and
Sensitivity on pages 9-10.
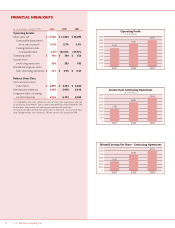
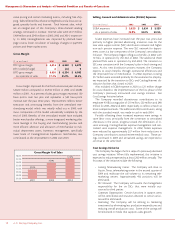
Retail Sales, Net
($ in millions) 2003 2002 2001
Retail sales, net $17,786 $17,633 $ 18,092
Sales percent increase/(decrease):
Tot al department stores 0.5%(1) 1.9% 1.5%
Comparable stores(2) 0.9% 2.7% 3.4%
Catalog/Internet 3.3%(3) (22.0)% (19.7)%
(1) Includes the effect of $158 million of sales for the 53rd week of 2003. On a 52-week
basis, total department store sales decreased 0.6%.
(2) Comparable store sales include the sales of stores after having been open for 12
consecutive fiscal months. Stores become comparable on the first day of the 13th
fiscal month. Comparable store sales are presented on a 52-week basis.
(3) Includes the effect of $46 million of sales for the 53rd week of 2003. On a 52-week
basis, total Catalog/Internet sales increased 1.5% and Internet sales increased 47.8%.
Comparable department store sales increased for the third
straight year. Despite starting off the year in a challenging retail
environment and generating a comparable store sales decrease of
4.8% in the first quarter, the Company took significant actions
related to merchandise content and marketing and recorded a
solid 3.2% comparable store sales gain for the fourth quarter and
0.9% for the full year. Sales, which benefited from a powerful
marketing program, were strong across the country and in most
merchandise divisions. Sales gains in 2003 were led by Home and
Jewelry. Specific categories performing exceptionally well were
diamonds, children’s apparel, window, bedding, housewares and
furniture. The Company’s seven key private brands—JCPenney
Home Collection, St. John’s Bay, Arizona, Worthington, Stafford,
Delicates and Okie Dokie—had strong sales with momentum
building in the second half. Women’s apparel sales were soft, par-
ticularly dresses, which experienced general weakness across the
industry. Total department store sales include sales from the
Renner Department Stores in Brazil of $273 million, $249 million
and $252 million in 2003, 2002 and 2001, respectively.
Catalog/Internet sales increased 3.3% for 2003, after experienc-
ing significant declines in both 2002 and 2001. Customers
responded favorably in 2003 to better merchandise assortments,
Diluted EPS from Continuing Operations
$1.40
$1.20
$1.00
$0.80
$0.60
$0.40
$0.20
$-
$0.57
$0.95
$1.21
2001 2002 2003