JCPenney 2003 Annual Report Download - page 45
Download and view the complete annual report
Please find page 45 of the 2003 JCPenney annual report below. You can navigate through the pages in the report by either clicking on the pages listed below, or by using the keyword search tool below to find specific information within the annual report.-
 1
1 -
2
-
3
-
4
-
5
-
6
-
7
-
8
-
9
-
10
-
11
-
12
-
13
-
14
-
15
-
16
-
17
-
18
-
19
-
20
-
21
-
22
-
23
-
24
-
25
-
26
-
27
-
28
-
29
-
30
-
31
-
32
-
33
-
34
-
 35
35 -
 36
36 -
 37
37 -
 38
38 -
 39
39 -
 40
40 -
 41
41 -
 42
42 -
 43
43 -
 44
44 -
 45
45 -
 46
46 -
 47
47 -
 48
48 -
 49
49 -
 50
50 -
 51
51 -
 52
52
 |
 |

J. C. Penney Company, Inc. 43
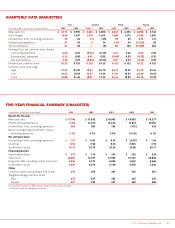
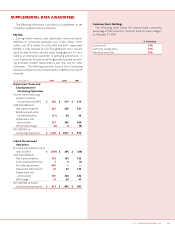
QUARTERLY DATA (UNAUDITED)
First Second Third Fourth
($ in millions, except per share data) 2003 2002 2003 2002 2003 2002 2003 2002
Retail sales, net $3,711 $3,990 $3,645 $3,606 $4,332 $4,294 $6,098 $5,743
Gross margin 1,456 1,507 1,310 1,302 1,666 1,575 2,188 1,950
Income/(loss) from continuing operations 20 62 (3) (20) 94 69 253 174
Discontinued operations 41 24 314 (14) 54 (1,322) 28
Net income/(loss) 61 86 —(6) 80 123 (1,069) 202
Earnings/(loss) per common share, diluted:
Continuing operations 0.05 0.20 (0.03) (0.10) 0.31 0.23 0.83 0.58
Discontinued operations 0.15 0.09 0.01 0.05 (0.04) 0.20 (4.25) 0.10
Net income/(loss) 0.20 0.29 (0.02) (0.05) 0.27 0.43 (3.42) 0.68
Dividend per common share 0.125 0.125 0.125 0.125 0.125 0.125 0.125 0.125
Common stock price range:
High 21.47 25.00 19.25 25.70 25.17 19.27 27.50 25.55
Low 16.55 18.83 15.57 14.50 17.25 14.07 22.29 18.45
Close 16.88 21.46 18.07 17.55 24.45 18.92 26.18 19.39
FIVE-YEAR FINANCIAL SUMMARY (UNAUDITED)
(in millions, except per share data) 2003 2002 2001 2000 1999
Results for the year
Retail sales, net $17,786 $17,633 $ 18,092 $ 18,693 $ 19,277
Percent increase/(decrease) 0.9% (2.5)% (3.2)% (3.0)% (0.6)%
Income/(loss) from continuing operations 364 285 182 (175) 436
Return on beginning stockholders’ equity –
continuing operations 5.7% 4.7% 2.9% (2.4)% 6.1%
Per common share
Income/(loss) from continuing operations(1) $1.21 $0.95 $ 0.57 $ (0.79) $ 1.54
Dividends 0.50 0.50 0.50 0.825 1.92
Stockholders’ equity 19.12 22.78 22.20 22.68 26.17
Financial position
Capital expenditures $373 $315 $ 315 $ 355 $ 338
Tot al assets 18,300 17,787 17,993 19,767 20,884
Long-term debt, including current maturities(2) 5,356 5,173 6,060 5,657 6,466
Stockholders’ equity 5,425 6,370 6,129 6,259 7,228
Other
Common shares outstanding at end of year 274 269 264 263 261
Weighted average common shares:
Basic 272 267 263 262 259
Diluted 297 293 267 262 260
(1) Calculation excludes the effects of anti-dilutive common stock equivalents.
(2) Includes capital lease obligations and other.