JCPenney 2003 Annual Report Download - page 4
Download and view the complete annual report
Please find page 4 of the 2003 JCPenney annual report below. You can navigate through the pages in the report by either clicking on the pages listed below, or by using the keyword search tool below to find specific information within the annual report.-
 1
1 -
 2
2 -
 3
3 -
 4
4 -
 5
5 -
 6
6 -
 7
7 -
 8
8 -
 9
9 -
 10
10 -
 11
11 -
 12
12 -
 13
13 -
 14
14 -
 15
15 -
16
-
17
-
18
-
19
-
20
-
21
-
22
-
23
-
24
-
25
-
26
-
27
-
28
-
29
-
30
-
31
-
32
-
33
-
34
-
35
-
36
-
37
-
38
-
39
-
40
-
41
-
42
-
43
-
44
-
45
-
46
-
47
-
48
-
49
-
50
-
51
-
52
 |
 |
J. C. Penney Company, Inc.2
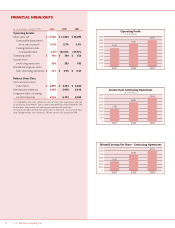
FINANCIAL HIGHLIGHTS
($ in millions, except EPS) 2003 2002 2001
Operating Results:
Retail sales, net $17,786 $17,633 $ 18,092
Comparable department
store sales increase(1) 0.9% 2.7% 3.4%
Catalog/Internet sales
increase/decrease 3.3%(2) (22.0)% (19.7)%
Operating profit $790 $700 $ 553
Income from
continuing operations 364 285 182
Diluted earnings per share
from continuing operations $1.21 $0.95 $ 0.57
Balance Sheet Data:
Cash and short-term
investments $2,994 $2,474 $ 2,840
Merchandise inventory 3,156 2,970 2,916
Long-term debt, including
current maturities 5,356 5,173 6,060
(1) Comparable store sales include the sales of stores after having been open for
12 consecutive fiscal months. Stores become comparable on the first day of the 13th
fiscal month. Comparable store sales are presented on a 52-week basis.
(2) Includes the effect of $46 million of sales for the 53rd week. On a 52-week basis,
total Catalog/Internet sales increased 1.5% and Internet sales increased 47.8%.
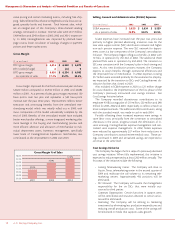
Income from Continuing Operations
($ in millions)
$400
$350
$300
$250
$200
$150
$100
$50
$-
$182
$285
$364
2001 2002 2003
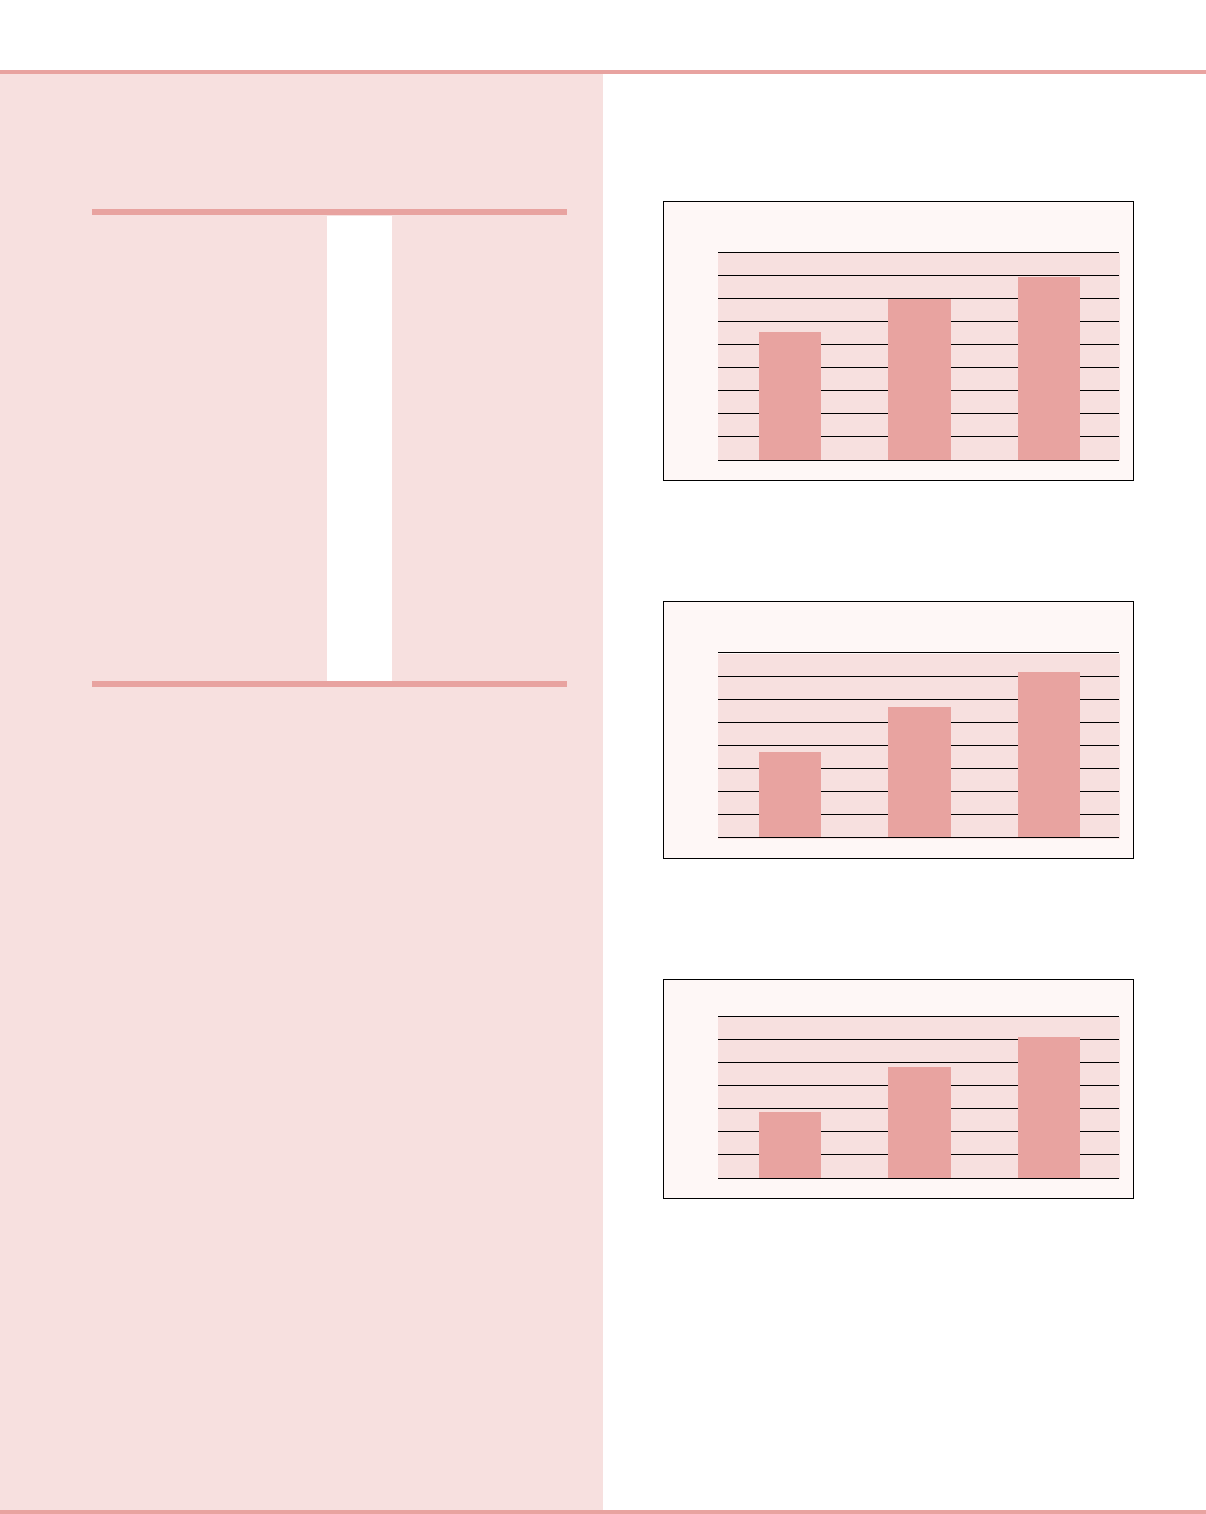
Operating Profit
($ in millions)
$900
$800
$700
$600
$500
$400
$300
$200
$100
$-
$553
$700
$790
2001 2002 2003
$1.40
$1.20
$1.00
$0.80
$0.60
$0.40
$0.20
$-
$0.57
$0.95
$1.21
2001 2002 2003
Diluted Earnings Per Share - Continuing Operations