JCPenney 2003 Annual Report Download - page 27
Download and view the complete annual report
Please find page 27 of the 2003 JCPenney annual report below. You can navigate through the pages in the report by either clicking on the pages listed below, or by using the keyword search tool below to find specific information within the annual report.-
 1
1 -
2
-
3
-
4
-
5
-
6
-
7
-
8
-
9
-
10
-
11
-
12
-
13
-
14
-
15
-
16
-
 17
17 -
 18
18 -
 19
19 -
 20
20 -
 21
21 -
 22
22 -
 23
23 -
 24
24 -
 25
25 -
 26
26 -
 27
27 -
 28
28 -
 29
29 -
 30
30 -
 31
31 -
 32
32 -
 33
33 -
 34
34 -
 35
35 -
 36
36 -
 37
37 -
38
-
39
-
40
-
41
-
42
-
43
-
44
-
45
-
46
-
47
-
48
-
49
-
50
-
51
-
52
 |
 |

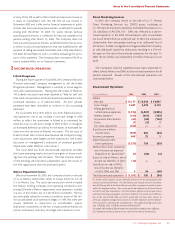
J. C. Penney Company, Inc. 25
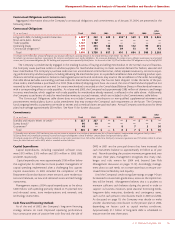
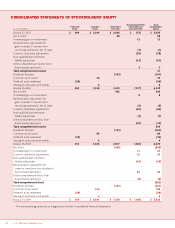
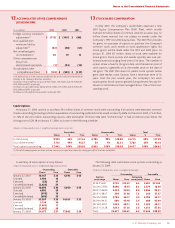
CONSOLIDATED STATEMENTS OF CASH FLOWS
($ in millions) 2003 2002 2001
Cash flows from operating activities:
Income from continuing operations $364 $285 $ 182
Adjustments to reconcile income from continuing
operations to net cash provided by operating activities:
Asset impairments, PVOL and other unit closing costs 35 77 67
Depreciation and amortization 394 369 369
Net gains on sale of assets (51) (18) (84)
Company contributions to savings and profit sharing plans —47 58
Benefit plans expense/(income) 135 30 (73)
Pension contribution (300) (300) —
Stock-based compensation 968
Deferred taxes 137 96 18
Change in cash from:
Receivables 3(13) 28
Inventory (100) 43 348
Prepaid expenses and other assets (36) (17) (29)
Accounts payable and accured expenses 94 53 (401)
Current income taxes payable (17) (102) (162)
Other liabilities 145 (34) 111
Net cash provided by operating activities 812 522 440
Cash flows from investing activities:
Capital expenditures (373) (315) (315)
Proceeds from sale of discontinued operations 20 —1,306
Proceeds from sale of assets 100 38 61
Net cash (used in)/provided by investing activities (253) (277) 1,052
Cash flows from financing activities:
Change in short-term debt 5(2) 15
Net proceeds from the issuance of long-term debt 607 27 630
Payment of long-term debt, including capital leases (450) (926) (257)
Common stock issued, net 52 30 30
Preferred stock redeemed (29) (30) (36)
Dividends paid, preferred and common (160) (161) (161)
Net cash provided by/(used in) financing activities 25 (1,062) 221
Cash (paid to)/received from discontinued operations (64) 451 183
Net increase/(decrease) in cash and short-term investments 520 (366) 1,896
Cash and short-term investments at beginning of year 2,474 2,840 944
Cash and short-term investments at end of year $2,994 $2,474 $ 2,840
The accompanying notes are an integral part of these Consolidated Financial Statements.