JCPenney 2003 Annual Report Download - page 31
Download and view the complete annual report
Please find page 31 of the 2003 JCPenney annual report below. You can navigate through the pages in the report by either clicking on the pages listed below, or by using the keyword search tool below to find specific information within the annual report.
J. C. Penney Company, Inc. 29
Notes to the Consolidated Financial Statements
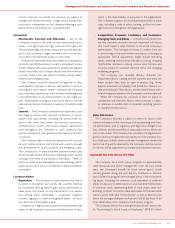
collateral for import letters of credit not included in the bank
credit facility and for a portion of casualty insurance program lia-
bilities. Cash and short-term investments on the consolidated
balance sheet included $8 million and $6 million of cash for 2003
and 2002, respectively.
Receivables, Net
Net Renner credit card receivables were $89 million and $66
million as of year-end 2003 and 2002, respectively. The corre-
sponding allowance for bad debts was $5 million and $4 million
at the end of 2003 and 2002, respectively. Also included in this
classification are notes and miscellaneous receivables.
Merchandise Inventories
Inventories are valued primarily at the lower of cost (using the
last-in, first-out or “LIFO” method) or market, determined by the
retail method for department stores and store support centers
(SSCs) and average cost for Catalog/Internet and regional ware-
houses. The lower of cost or market is determined on an aggregate
basis for similar types of merchandise. To estimate the effects of
inflation/deflation on ending inventory, an internal index measur-
ing price changes from the beginning to the end of the year is cal-
culated using merchandise cost data at the item level. Prior to 2002,
the internal index was based on retail prices. Retail pricing is influ-
enced by such factors as changes in pricing strategies, competitive
pricing and changes in styles and fashion, particularly in apparel
merchandise. All these factors make it difficult to estimate infla-
tion/deflation rates. Accordingly, management changed the basis
of the calculation to vendor cost because it would result in a more
accurate measure of inflation/deflation rates used to adjust inven-
tory cost under the LIFO method of inventory valuation. The
change resulted in a LIFO provision for 2002 of $6 million versus a
credit of $17 million under the prior method. For 2002, net
income was lower by $14 million and both basic and diluted EPS
were lower by $0.06 as a result of this change. The cumulative
effect of the accounting change and pro forma amounts for peri-
ods prior to 2002 are not determinable because cost data is not
available to calculate internal indices for years prior to 2002.
The total Company LIFO (credits)/charges included in cost of
goods sold were $(6) million, $6 million and $(9) million in 2003,
2002 and 2001, respectively. If the first-in, first-out or “FIFO”
method of inventory valuation had been used instead of the LIFO
method, inventories would have been $43 million and $49 million
higher at January 31, 2004 and January 25, 2003, respectively.
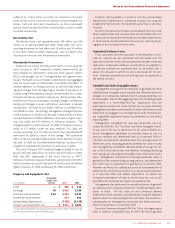
Property and Equipment, Net
Estimated
Useful Lives
($ in millions) (Years) 2003 2002
Land —$206 $210
Buildings 50 2,554 2,539
Furniture and equipment 3-20 2,203 2,292
Leasehold improvements(1) 674 685
Accumulated depreciation (2,122) (2,122)
Property and equipment, net $3,515 $3,604
(1) Leasehold improvements are depreciated over the shorter of the estimated useful
lives of the improvements or the term of the lease.
Property and equipment is stated at cost less accumulated
depreciation. Depreciation is computed primarily by using the
straight-line method over the estimated useful lives of the relat-
ed assets.
Routine maintenance and repairs are expensed when incurred.
Major replacements and improvements are capitalized. The cost
of assets sold or retired and the related accumulated depreciation
or amortization are removed from the accounts, with any result-
ing gain or loss included in net income.
Capitalized Software Costs
Costs associated with the acquisition or development of soft-
ware for internal use are capitalized and amortized over the
expected useful life of the software, generally between three and
seven years. Subsequent additions, modifications or upgrades to
internal-use software are capitalized only to the extent that it
allows the software to perform a task it previously did not per-
form. Software maintenance and training costs are expensed in
the period incurred.
Goodwill and Other Intangible Assets
Management evaluates the recoverability of goodwill and other
indefinite-lived intangible assets annually and whenever events or
changes in circumstances indicate that the carrying value may not
be recoverable. One of the triggering events for possible goodwill
impairment is a “more-likely-than-not” expectation that the
reporting unit will be sold. Given the fact that as of year-end 2003
management had been authorized by the Board of Directors to sell
Eckerd and was engaged in active negotiations with interested par-
ties, a goodwill impairment review was performed at the Eckerd
reporting level.
Management completed the two-step impairment test pre-
scribed by SFAS No. 142, “Goodwill and Other Intangible Assets.”
In step one of the test, to determine the fair value of Eckerd as a
whole, management developed an estimate based on the bid
amounts received, and determined that, as of year-end 2003, an
indication of impairment existed because the carrying amount of
Eckerd net assets, including goodwill, exceeded fair value. In step
two, management completed a detailed analysis to assign fair val-
ues to all of the Eckerd assets and liabilities, including identifying
and valuing any unrecognized intangible assets that have current
value. Management compared the resulting implied fair value of
goodwill to the corresponding carrying amount, and determined
that there was no impairment of goodwill as of year-end 2003.
However, see Note 2 for a related discussion of the presentation of
Eckerd results and financial condition as a discontinued operation
as of year-end 2003, and related adjustments to reduce the
Company’s investment in Eckerd to the fair value less costs to sell,
and reflect the estimated tax impact of a potential sale.
Management also performed the annual evaluation of goodwill
as it relates to the Company’s investment in its Renner Department
Stores in Brazil. The fair value of the Company’s Renner
Department Store operation was determined using the expected
present value of corresponding future cash flows, discounted at a
risk-adjusted rate. Management concluded that there was no evi-
dence of impairment as of year-end 2003.
Since the Company adopted SFAS No. 142 at the beginning of
2002, to present comparable data for 2001 the following table


