JCPenney 2003 Annual Report Download - page 30
Download and view the complete annual report
Please find page 30 of the 2003 JCPenney annual report below. You can navigate through the pages in the report by either clicking on the pages listed below, or by using the keyword search tool below to find specific information within the annual report.-
 1
1 -
2
-
3
-
4
-
5
-
6
-
7
-
8
-
9
-
10
-
11
-
12
-
13
-
14
-
15
-
16
-
17
-
18
-
19
-
 20
20 -
 21
21 -
 22
22 -
 23
23 -
 24
24 -
 25
25 -
 26
26 -
 27
27 -
 28
28 -
 29
29 -
 30
30 -
 31
31 -
 32
32 -
 33
33 -
 34
34 -
 35
35 -
 36
36 -
 37
37 -
 38
38 -
 39
39 -
 40
40 -
41
-
42
-
43
-
44
-
45
-
46
-
47
-
48
-
49
-
50
-
51
-
52
 |
 |

J. C. Penney Company, Inc.28
Notes to the Consolidated Financial Statements
another significant assumption used in the actuarial model for
pension accounting and is determined based upon the
Company’s long-term plans for such increases. For retiree medical
plan accounting, the health care cost trend rates do not have a
material impact since dollar limits have been placed on Company
contributions.
Income Taxes
Income taxes are accounted for under the asset and liability
method. Deferred tax assets and liabilities are recognized for the
future tax consequences attributable to differences between the
financial statement carrying amounts of existing assets and liabil-
ities and their respective tax bases and operating loss and tax
credit carryforwards. Deferred tax assets and liabilities are meas-
ured using enacted tax rates expected to apply to taxable
income in the years in which those temporary differences are
expected to be recovered or settled. The effect on deferred tax
assets and liabilities of a change in tax rates is recognized in
income in the period that includes the enactment date. A valua-
tion allowance is recorded to reduce the carrying amounts of
deferred tax assets unless it is more likely than not that such
assets will be realized.
Earnings/(Loss) per Common Share
Basic earnings per share (EPS) is computed by dividing net
income/(loss) less dividend requirements on the Series B ESOP
Convertible Preferred Stock, net of tax as applicable, by the weight-
ed average number of common shares outstanding for the period.
Except when the effect would be anti-dilutive at the continuing
operations level, the diluted EPS calculation includes the impact of
restricted stock units and shares that could be issued under out-
standing stock options as well as common shares that would result
from the conversion of convertible debentures and convertible
preferred stock. In addition, the related interest on convertible
debentures (net of tax) and preferred stock dividends (net of tax)
are added back to income, since these would not be paid if the
debentures or preferred stock were converted to common stock.
Stock-Based Compensation
The Company has a stock-based compensation plan, which is
discussed more fully in Note 13. The Company accounts for the
plan under the recognition and measurement principles of
Accounting Principles Board Opinion No. 25, “Accounting for
Stock Issued to Employees” (APB 25), and related Interpretations.
No stock-based employee compensation cost is reflected in net
income for stock options, as all options granted under the plan
had an exercise price equal to the market value of the underlying
common stock on the date of grant. Compensation expense for
restricted stock awards with pro rata vesting is recorded on a
straight-line basis over the vesting period, which typically ranges
from one to five years.
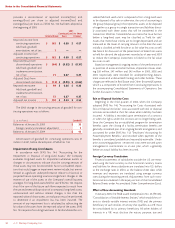
The following table illustrates the effect on net (loss)/income
and EPS as if the Company had applied the fair value recognition
provisions of SFAS No. 123, “Accounting for Stock-Based
Compensation,” to stock options.
($ in millions, except EPS) 2003 2002 2001
Net (loss)/income, as
reported $(928) $405 $ 98
Add: Stock-based employee
compensation expense
included in reported net
income, net of related tax
effects 535
Deduct: Total stock-based
employee compensation
expense determined under
fair value method for all
awards, net of related
tax effects (26) (23) (24)
Pro forma net (loss)/income $(949) $385 $ 79
(Loss)/earnings per share:
Basic—as reported $(3.50) $1.41 $ 0.26
Basic—pro forma $(3.58) $1.34 $ 0.19
Diluted—as reported $(3.13) $1.36 $ 0.26
Diluted—pro forma $(3.20) $1.30 $ 0.19
The Company used the Black-Scholes option-pricing model to
estimate the grant date fair value of its stock option grants for
the periods presented above. The following Black-Scholes
assumptions were used to estimate the grant date fair value of
stock options:
Option Assumptions 2003 2002 2001
Dividend yield 3.9% 3.9% 4.2%
Expected volatility 42.4% 40.0% 40.2%
Risk-free interest rate 3.4% 4.7% 4.8%
Expected option term 7 years 7 years 5 years
Weighted-average fair value
of options at grant date $6.07 $6.32 $ 4.36
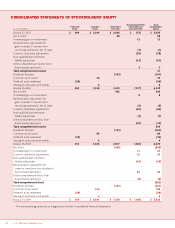
Comprehensive Income/(Loss)
Comprehensive income/(loss) consists of two components:
net income/(loss) and other comprehensive income/(loss).
Other comprehensive income/(loss) is the sum of currency trans-
lation adjustments, unrealized gains/(losses) on investments and
non-qualified plan minimum liability adjustments. Other com-
prehensive income/(loss) is presented in the Consolidated
Statements of Stockholders’ Equity.
Cash and Short-Term Investments
All highly liquid investments with original maturities of three
months or less are considered to be short-term investments. The
short-term investments consist primarily of eurodollar time
deposits and money market funds and are stated at cost, which
approximates fair market value.
Total cash and short-term investments were $2,994 million and
$2,474 million for 2003 and 2002, respectively, and included
restricted short-term investment balances of $87 million and $86
million for the same periods. Restricted balances are pledged as