JCPenney 2003 Annual Report Download - page 18
Download and view the complete annual report
Please find page 18 of the 2003 JCPenney annual report below. You can navigate through the pages in the report by either clicking on the pages listed below, or by using the keyword search tool below to find specific information within the annual report.-
 1
1 -
2
-
3
-
4
-
5
-
6
-
7
-
 8
8 -
 9
9 -
 10
10 -
 11
11 -
 12
12 -
 13
13 -
 14
14 -
 15
15 -
 16
16 -
 17
17 -
 18
18 -
 19
19 -
 20
20 -
 21
21 -
 22
22 -
 23
23 -
 24
24 -
 25
25 -
 26
26 -
 27
27 -
 28
28 -
29
-
30
-
31
-
32
-
33
-
34
-
35
-
36
-
37
-
38
-
39
-
40
-
41
-
42
-
43
-
44
-
45
-
46
-
47
-
48
-
49
-
50
-
51
-
52
 |
 |

J. C. Penney Company, Inc.16
Management’s Discussion and Analysis of Financial Condition and Results of Operations
To minimize the impact from unforeseen events, management
has developed various contingency plans to provide alternative
courses of action under several scenarios, including deteriorating
economic conditions, potential shortfalls in profits or cash flow
and limited access to the capital markets. Such actions include
adjustments to capital expenditure and working capital levels, as
necessary, to maintain liquidity and financial flexibility within the
parameters of the Company’s long-term financing strategy.
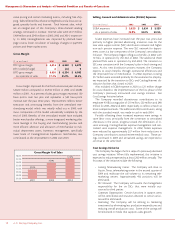
For 2004, free cash flow is expected to be negative by approx-
imately $150 million. This reflects capital expenditures of approx-
imately $500 million, higher working capital needs related to
inventory, the reversal of 2003’s accounts payable and accrued
expense benefits associated with the 53rd week, and dividend
payments, which are subject to approval by the Company’s
Board of Directors.
In accordance with its long-term financing strategy, the
Company manages its financial position on a multi-year basis and
may access the capital markets opportunistically. As a result of its
strong liquidity position, the Company does not anticipate that
additional external financing will be required in 2004 to fund its
operating or strategic initiatives. Additionally, the Company does
not expect to borrow under the $1.5 billion credit facility except
to support ongoing letters of credit.
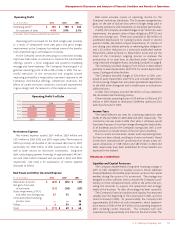
Dividend Policy
JCPenney paid quarterly dividends of $0.125 per share in 2003.
The Company’s Board of Directors reviews the dividend policy
and rate on a quarterly basis, taking into consideration the over-
all financial and strategic outlook for the Company, earnings, liq-
uidity and cash flow projections, as well as competitive factors.
Operating Leases and Guarantees
Management takes operating leases into consideration in eval-
uating the Company’s capital structure and overall liquidity. See
discussions on pages 15-17 and Note 14.
In December 2003, as part of the previously discussed cost sav-
ings initiative, JCP notified the third-party service providers of the
six outsourced SSCs of its intent to terminate their services during
the first half of 2004. On January 30, 2004, JCP purchased the
equipment of four outsourced SSCs for $34 million. In accordance
with the related service contracts, JCP will assume financial respon-
sibility for the building and remaining equipment leases upon ter-
mination. As of January 31, 2004, JCP’s potential obligation related
to these leases was $120 million.
JCP, through a wholly owned subsidiary, has investments in 15
partnerships that own regional mall properties, seven as general
partner and eight as a limited partner. JCP’s potential exposure to
risk is greater in partnerships in which it is a general partner.
Mortgages on the seven general partnerships total approximate-
ly $345 million; however, the estimated market value of the
underlying properties is approximately $600 million. These mort-
gages are non-recourse to JCP, so any financial exposure is
minimal. In addition, the subsidiary has guaranteed loans totaling
approximately $18 million related to investments in one real
estate investment trust (REIT). The estimated market value of
the underlying properties significantly exceeds the outstanding
mortgage loans, and the loan guarantee to market value ratio is
less than 6% as of January 31, 2004. In the event of possible
default, the creditors would recover first from the proceeds of
the sale of the properties, next from the general partner, then
from other guarantors before JCP’s guarantee would be invoked.
As a result, management does not believe that any potential
financial exposure related to these guarantees would have a
material impact on the Company’s financial position or results of
operations.
As part of the 2001 DMS sale, the Company signed a guaran-
tee agreement with a maximum exposure of $20 million. This
relates to the 1994 sale of a block of long-term care business by a
former subsidiary to a third party. As part of the 1994 sale agree-
ment, the purchaser was required to maintain adequate reserves
in a trust. The Company’s guarantee is the lesser of any reserve
shortfall or $20 million. Any potential claims or losses are first
recovered from established reserves, then from the purchaser
and finally from any state insurance guarantee fund before the
Company’s guarantee would be invoked. It is uncertain if, or
when, the Company would be required to pay any claims under
this guarantee.
Foreign Currency Risk
The Company operates 58 Renner Department Stores in Brazil.
Sales were $273 million, $249 million and $252 million for 2003,
2002 and 2001, respectively. For the year ended January 31, 2004,
other comprehensive income on currency translation for Brazil
was a favorable adjustment of approximately $25 million. As part
of the 2003 loss on the sale of its Mexico department stores, the
Company recognized $25 million related to currency translation
losses accumulated since Mexico operations began in 1995.
Currency translation losses had been previously reflected
through reductions to stockholders’ equity. Due to the limited
nature of foreign operations, management believes that its expo-
sure to market risk associated with foreign currencies does not
have a material impact on its financial condition or results of
operations.
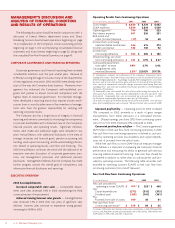
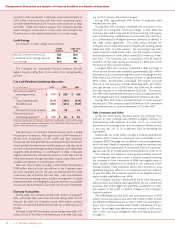
Merchandise Inventory
Total LIFO inventory was $3,156 million at the end of 2003
compared with $2,970 million at the end of 2002. FIFO merchan-
dise inventory was $3,199 million at the end of 2003, an increase
from the prior year end of 6.0%. Although higher than last year’s
levels, inventories contain significantly less clearance merchandise
than last year and are well positioned with merchandise for the
upcoming spring season as well as better in-stocks of basics.
Enhanced inventory management, with improvement in seasonal
transitions, has helped to drive more profitable sales. In addition,
Catalog/Internet inventories are higher than last year, as planned,
to reflect Catalog/Internet’s improved sales trends. This higher
inventory level has resulted in a significant improvement in filling
customers’ orders.