JCPenney 2003 Annual Report Download - page 47
Download and view the complete annual report
Please find page 47 of the 2003 JCPenney annual report below. You can navigate through the pages in the report by either clicking on the pages listed below, or by using the keyword search tool below to find specific information within the annual report.-
 1
1 -
2
-
3
-
4
-
5
-
6
-
7
-
8
-
9
-
10
-
11
-
12
-
13
-
14
-
15
-
16
-
17
-
18
-
19
-
20
-
21
-
22
-
23
-
24
-
25
-
26
-
27
-
28
-
29
-
30
-
31
-
32
-
33
-
34
-
35
-
36
-
 37
37 -
 38
38 -
 39
39 -
 40
40 -
 41
41 -
 42
42 -
 43
43 -
 44
44 -
 45
45 -
 46
46 -
 47
47 -
 48
48 -
 49
49 -
 50
50 -
 51
51 -
 52
52
 |
 |

J. C. Penney Company, Inc. 45
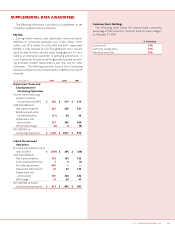
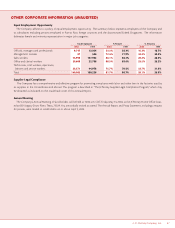
SUPPLEMENTAL DATA (UNAUDITED)
The following information is provided as a supplement to the
Company’s audited financial statements.
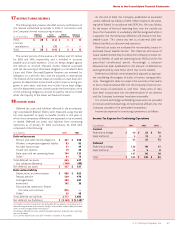
EBITDA
Earnings before interest, taxes, depreciation and amortization
(EBITDA) of continuing operations was $1,156 million, $1,071
million and $912 million for 2003, 2002 and 2001, respectively.
EBITDA is a key measure of cash flow generated and is focused
upon by debt investors and the credit rating agencies. It is pro-
vided as an alternative assessment of operating performance. It
is not intended to be a substitute for generally accepted account-
ing principles (GAAP) measurements and may vary for other
companies. The following reconciles Income from Continuing
Operations before Income Taxes (GAAP) to EBITDA (non-GAAP
measure).
($ in millions) 2003 2002 2001
Department Stores and
Catalog/Internet
Continuing Operations
Income from continuing
operations before
income taxes (GAAP) $546 $415 $ 274
Add back/(deduct):
Net interest expense 261 226 231
Real estate and other
(income)/expense (17) 59 48
Depreciation and
amortization 372 365 368
LIFO (credit)/charge (6) 6(9)
FIFO EBITDA of
continuing operations $1,156 $1,071 $ 912
Eckerd Discontinued
Operations
(Loss)/income before income
taxes (GAAP) $(369) $204 $ (64)
Add back/(deduct):
Net interest expense 163 161 153
Other expense/(income) 75(1)
Fair value adjustment 450 ——
Acquisition amortization 40 42 120
Depreciation and
amortization 301 253 226
LIFO charge 21 20 47
FIFO EBITDA of Eckerd
discontinued operations $613 $685 $ 481
Common Stock Holdings
The following table shows the approximate ownership
percentage of the Company’s common stock by major category
as of January 31, 2004:
% Ownership
Institutional 74%
Company savings plans 16%
Individual and other 10%