JCPenney 2003 Annual Report Download - page 37
Download and view the complete annual report
Please find page 37 of the 2003 JCPenney annual report below. You can navigate through the pages in the report by either clicking on the pages listed below, or by using the keyword search tool below to find specific information within the annual report.-
 1
1 -
2
-
3
-
4
-
5
-
6
-
7
-
8
-
9
-
10
-
11
-
12
-
13
-
14
-
15
-
16
-
17
-
18
-
19
-
20
-
21
-
22
-
23
-
24
-
25
-
26
-
 27
27 -
 28
28 -
 29
29 -
 30
30 -
 31
31 -
 32
32 -
 33
33 -
 34
34 -
 35
35 -
 36
36 -
 37
37 -
 38
38 -
 39
39 -
 40
40 -
 41
41 -
 42
42 -
 43
43 -
 44
44 -
 45
45 -
 46
46 -
 47
47 -
48
-
49
-
50
-
51
-
52
 |
 |

J. C. Penney Company, Inc. 35
Notes to the Consolidated Financial Statements
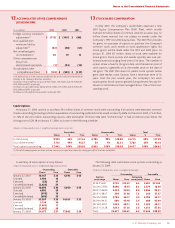
12 ACCUMULATED OTHER COMPREHENSIVE
(LOSS)/INCOME
($ in millions) 2003 2002 2001
Foreign currency translation
adjustments(1) $(115) $(140) $ (86)
Non-qualified plan
minimum liability
adjustment(2) (82) (58) (51)
Net unrealized gains
on investments(3) 60 19 14
Other comprehensive
(loss) from
discontinued operations (1)(4) (24) (14)
Accumulated other
comprehensive (loss) $(138) $(203) $ (137)
(1) A deferred tax asset has not been established due to the historical reinvestment of
earnings in the Company’s Brazilian subsidiary.
(2) Shown net of a deferred tax asset of $52 million, $39 million and $33 million for
2003, 2002 and 2001, respectively.
(3) Shown net of a deferred tax liability of $32 million, $10 million and $8 million for
2003, 2002 and 2001, respectively.
(4) Shown net of a deferred tax asset of $1 million for 2003.
13 STOCK-BASED COMPENSATION
In May 2001, the Company’s stockholders approved a new
2001 Equity Compensation Plan (2001 Plan), which initially
reserved 16 million shares of common stock for issuance, plus 1.2
million shares reserved but not subject to awards under the
Company’s 1997 and 2000 equity plans. The 2001 Plan provides
for grants to associates of options to purchase the Company’s
common stock, stock awards or stock appreciation rights. No
future grants will be made under the 1997 and 2000 plans. At
January 31, 2004, 8.7 million shares of stock were available for
future grants. Stock options and awards typically vest over per-
formance periods ranging from one to five years. The number of
option shares is fixed at the grant date, and the exercise price of
stock options is generally set at the market price on the date of
the grant. The 2001 Plan does not permit stock options below
grant date market value. Options have a maximum term of 10
years. Over the past several years, the Company’s net stock
option grants (stock options granted during the year, less any for-
feitures or terminations) have averaged about 1.5% of total out-
standing stock.
Stock Options
At January 31, 2004, options to purchase 24.5 million shares of common stock were outstanding. If all options were exercised, common
shares outstanding (including common equivalents of outstanding preferred stock) would increase by 8.6%. At the end of 2003, 17.6 million,
or 72% of the 24.5 million outstanding options, were exercisable. Of those, 56% were "in-the-money" or had an exercise price below the
closing price of $26.18 on January 31, 2004, as shown in the following schedule:
(shares in thousands, price is weighted average exercise price)
Exercisable Unexercisable Total
Shares % Price Shares % Price Shares % Price
In-the-money 9,930 56% $17.44 6,785 99% $18.80 16,715 68% $17.99
Out-of-the-money(1) 7,712 44% 45.27 50 1% 32.21 7,762 32% 45.16
Tot al options outstanding 17,642 100% $29.59 6,835 100% $18.93 24,477 100% $26.61
(1) Out-of-the-money options are those with an exercise price equal to or above the closing price of $26.18 at the end of 2003.
A summary of stock option activity follows:
(shares in thousands, price is weighted average exercise price)
Outstanding Exercisable
Shares Price Shares Price
January 27, 2001 18,167 $ 33 6,592 $ 48
Granted 3,402 16
Exercised (56) 17
Canceled/forfeited (2,823) 29
January 26, 2002 18,690 $ 30 5,840 $ 48
Granted 4,993 20
Exercised (610) 15
Canceled/forfeited (806) 38
January 25, 2003 22,267 $ 28 14,551 $ 33
Granted 5,136 20
Exercised (1,843) 17
Canceled/forfeited (1,083) 39
January 31, 2004 24,477 $ 27 17,642 $ 30
The following table summarizes stock options outstanding at
January 31, 2004:
(shares in thousands, price is weighted average)
Outstanding Exercisable
Exercise Remaining
price range Shares Price term (years) Shares Price
$9.32-$16.00 3,755 $15.01 6.4 3,681 $15.04
$16.06-$19.80 8,696 18.10 8.1 2,374 16.39
$20.01-$24.80 4,223 20.35 8.0 3,844 20.31
$25.31-$28.57 303 27.36 7.2 243 27.17
$32.05-$40.84 3,784 36.17 4.5 3,784 36.17
$43.00-$44.31 680 43.40 2.4 680 43.40
$47.69-$50.91 1,423 48.11 2.2 1,423 48.11
$55.31-$71.28 1,613 67.25 2.6 1,613 67.25
To t al 24,477 $26.61 6.4 17,642 $29.59