JCPenney 2003 Annual Report Download - page 34
Download and view the complete annual report
Please find page 34 of the 2003 JCPenney annual report below. You can navigate through the pages in the report by either clicking on the pages listed below, or by using the keyword search tool below to find specific information within the annual report.-
 1
1 -
2
-
3
-
4
-
5
-
6
-
7
-
8
-
9
-
10
-
11
-
12
-
13
-
14
-
15
-
16
-
17
-
18
-
19
-
20
-
21
-
22
-
23
-
 24
24 -
 25
25 -
 26
26 -
 27
27 -
 28
28 -
 29
29 -
 30
30 -
 31
31 -
 32
32 -
 33
33 -
 34
34 -
 35
35 -
 36
36 -
 37
37 -
 38
38 -
 39
39 -
 40
40 -
 41
41 -
 42
42 -
 43
43 -
 44
44 -
45
-
46
-
47
-
48
-
49
-
50
-
51
-
52
 |
 |

J. C. Penney Company, Inc.32
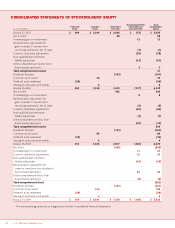
Notes to the Consolidated Financial Statements
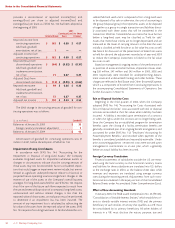
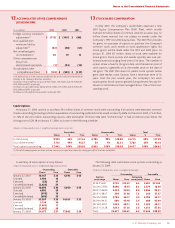
The assets and liabilities of discontinued operations were as follows:
2003 2002
($ in millions) Eckerd Eckerd Mexico Total
Cash and short-term
investments $7$8$6$14
Receivables 441 494 3 497
Merchandise inventory 1,986 1,963 12 1,975
Prepaid expenses 33 27 1 28
Tot al current assets 2,467 2,492 22 2,514
Property and
equipment, net 1,468 1,297 –– 1,297
Goodwill 2,269 2,269 –– 2,269
Intangible assets 443 494 –– 494
Other assets 157 172 3 175
Tot al A ssets $6,804 $6,724 $ 25 $ 6,749
Accounts payable and
accrued expenses $1,422 $1,439 $ — $ 1,439
Current deferred taxes 87 91 –– 91
Tot al current liabilities 1,509 1,530 –– 1,530
Long-term deferred taxes 218 232 –– 232
Other liabilities 259 254 –– 254
Tot al Liabilities $1,986 $2,016 $ — $ 2,016
JCPenney’s net investment $4,818 $4,708 $ 25 $ 4,733
Fair value adjustment (450)
Fair value of JCPenney’s
investment in Eckerd $4,368
As of January 31, 2004, Eckerd securitized managed care receiv-
ables totaled $218 million. This securitization program would be
terminated and the debt paid upon closing of a sale of Eckerd.
The unwinding of the securitization transaction was included in the
determination of the Eckerd fair value adjustment.
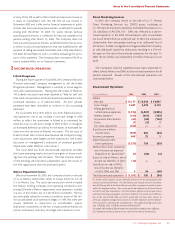
3EARNINGS PER SHARE
Income from continuing operations and shares used to com-
pute income per share from continuing operations, basic and
diluted, are reconciled below:
(in millions) 2003 2002 2001
Income from continuing
operations $364 $285 $ 182
Less: preferred stock dividends 25 27 29
Income from continuing
operations, basic $339 $258 $ 153
Adjustment for assumed
dilution: Interest of 5%
convertible debt, net of tax 22 22 ––
Income from continuing
operations, diluted $361 $280 $ 153
Shares:
Average common shares
outstanding (basic shares) 272 267 263
Adjustment for assumed dilution:
Stock options and
restricted stock units 234
Shares from convertible debt 23 23 ––
Average shares assuming
dilution (diluted shares) 297 293 267
The following average potential shares of common stock were
excluded from the diluted EPS calculations because their effect
would be anti-dilutive:
(shares in millions) 2003 2002 2001
Stock options(1) 899
$650 million notes
convertible at
$28.50 per share –– —7
Preferred stock 11 11 13
Tot al anti-dilutive
potential shares 19 20 29
(1) Exercise prices per share ranged from $20 to $71, $21 to $71 and $23 to $71 for
2003, 2002 and 2001, respectively.
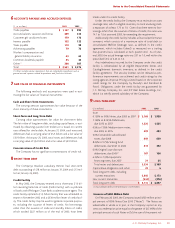
4SUPPLEMENTAL CASH FLOW INFORMATION
($ in millions) 2003 2002 2001
Income taxes paid $50$136 $ 225
Interest paid 420 422 420
Interest received 188 198 201
2003
•The Company issued 2.4 million shares of common stock to
fund the 2002 contribution of $47 million to the savings plan.
2002
•The Company issued 2.9 million shares of common stock to
fund the 2001 contribution of $58 million to the savings plan.
•The Company exchanged certain notes and debentures with
a carrying amount of $227 million for new notes recorded at
a fair value of $225 million.
5OTHER ASSETS
($ in millions) 2003 2002
Real estate investments $169 $106
Leveraged lease investments 134 131
Capitalized software, net 97 94
Deferred catalog book costs 77 73
Debt issuance costs, net 52 46
Other 27 41
Tot al $556 $491