JCPenney 2003 Annual Report Download - page 40
Download and view the complete annual report
Please find page 40 of the 2003 JCPenney annual report below. You can navigate through the pages in the report by either clicking on the pages listed below, or by using the keyword search tool below to find specific information within the annual report.-
 1
1 -
2
-
3
-
4
-
5
-
6
-
7
-
8
-
9
-
10
-
11
-
12
-
13
-
14
-
15
-
16
-
17
-
18
-
19
-
20
-
21
-
22
-
23
-
24
-
25
-
26
-
27
-
28
-
29
-
 30
30 -
 31
31 -
 32
32 -
 33
33 -
 34
34 -
 35
35 -
 36
36 -
 37
37 -
 38
38 -
 39
39 -
 40
40 -
 41
41 -
 42
42 -
 43
43 -
 44
44 -
 45
45 -
 46
46 -
 47
47 -
 48
48 -
 49
49 -
 50
50 -
51
-
52
 |
 |

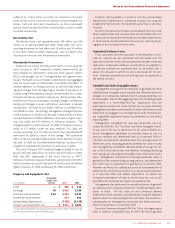
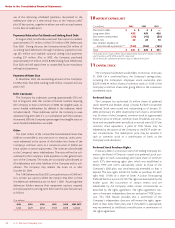
J. C. Penney Company, Inc.38
Notes to the Consolidated Financial Statements
In the PBO reconciliation, the actuarial loss increased from $89
million in 2002 to $379 million in 2003 primarily as a result of
interest rates generally declining over this period and the
Company lowering the discount rate from 7.10% in 2002 to
6.35% in 2003.
In the reconciliation of the fair value of plan assets, the swing
of more than $700 million in the actual return on assets, which is
net of plan administrative expenses, was due to the poor capital
market returns in 2002 and the market rebound in 2003. The
one-year return on plan assets at the October 31 measurement
date in 2003 and 2002 was 19.5% and (6.7)%, respectively.
The unrecognized losses, including prior service cost, of $1,099
million will be amortized, subject to a corridor as permitted under
SFAS No. 87, as pension expense over the average remaining serv-
ice period of the covered workforce. Such amortization, included
in total pension expense, will reduce the prepaid pension cost.
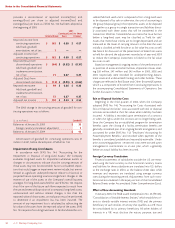
Assumptions to Determine Obligations —The weighted aver-
age actuarial assumptions used to determine benefit obligations
at the October 31 measurement dates were as follows:
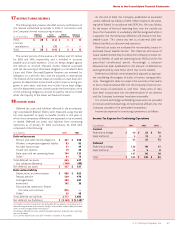
Assumptions 2003 2002 2001
Discount rate 6.35% 7.10% 7.25%
Salary progression rate 4.0% 4.0% 4.0%
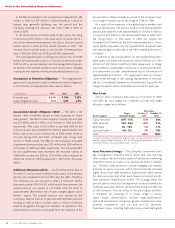
Accumulated Benefit Obligation (ABO) —The ABO is the
present value of benefits earned to date, assuming no future
salary growth. The ABO for the Company’s primary pension plan
was $3.0 billion and $2.6 billion as of October 31, 2003 and 2002,
respectively. Plan assets of $3.5 billion at year-end 2003 for the
primary pension plan exceeded the ABO by approximately $0.5
billion, due to total cash contributions of $600 million made to
the plan during 2003 and 2002, combined with strong asset
returns of 19.5% in 2003. The ABO for the Company’s unfunded
supplemental pension plans was $372 million and $318 million as
of October 31, 2003 and 2002, respectively. The unfunded ABO
for the supplemental plans exceeded the recorded liability of
$228 million at year-end 2003 by $134 million, which required an
additional minimum liability adjustment. See further discussion
below.
Additional Minimum Liability —At the measurement date of
October 31, the fair value of pension plan assets in the primary
pension plan exceeded both the PBO and the ABO. Therefore,
the Company was not required to reflect a minimum liability
adjustment under SFAS No. 87, which would have removed the
prepaid pension cost (asset) of $1.3 billion with the offset of
approximately $800 million, net of taxes, charged against stock-
holders’ equity. The prepaid pension cost carried on the
Company’s balance sheet as of year-end 2003 represents pension
funding as well as return on plan assets in excess of pension
expense recognized through the statement of operations. The
prepaid pension cost has accumulated from the inception of the
pension plan in 1966 principally as a result of the Company’s pol-
icy to target a funded ratio in the range of 110% to 130%.
As a result of the weakness in the global equity markets over
the past several years, the pension surplus of the defined benefit
pension plan declined from approximately $1.2 billion in 2000 to
a surplus of $45 million at the measurement date in 2002. With
the strong return on plan assets in 2003, this surplus has
increased to $219 million at the 2003 measurement date. A min-
imum liability adjustment for the supplemental retirement plan
was required again in 2003 due to the ABO exceeding the record-
ed liability.
In addition to the accrued liability for the supplemental retire-
ment plans, the additional minimum liability balance was $134
million and $97 million in 2003 and 2002, respectively. A charge
was recorded to stockholders’ equity, net of income tax benefits,
as a component of other comprehensive loss in the amount of
approximately $24 million. This adjustment does not impact
current year earnings or the funding requirements of the plan.
See the Consolidated Statements of Stockholders’ Equity for the
charge included in other comprehensive income for each year.
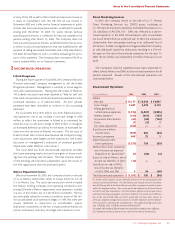
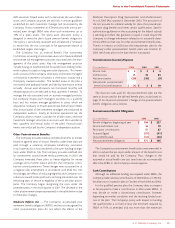
Plan Assets
The fair value of pension plan assets as of October 31, 2003
and 2002, by asset category as a percent to total, and target
allocation ranges are as follows:
Plan Assets
Target October 31, October 31,
Asset Category Allocation Ranges 2003 2002
Equity securities(1) 65% - 75% 62% 58%
Debt securities 15% - 25% 20% 21%
Real estate 5% - 15% 9% 11%
Cash and other(1) 0% - 5% 9% 10%
Tot al 100% 100%
(1) Cash investments exceeded the targeted range, and equity securities were less
than the targeted range temporarily, due to the timing of contributions relative to
investments made in equity and fixed income securities.
Asset Allocation Strategy —The Company’s investment strat-
egy is designed to provide a rate of return that, over the long
term, increases the ratio of plan assets to liabilities by maximizing
investment return on assets, at an appropriate level of volatility
risk. The plan’s asset portfolio is actively managed and invested
primarily in equity securities, which have historically provided
higher returns than debt portfolios, balanced with fixed income
(i.e, debt securities) and other asset classes to maintain an effi-
cient risk/return diversification profile. This strategy allows the
pension plan to serve as a funding vehicle to secure benefits for
Company associates, while at the same time being cost effective
to the Company. The risk of loss in the plan’s equity portfolio
is mitigated by investing in a broad range of equity
types. Equity diversification includes large-capitalization
and small-capitalization companies, growth-oriented and value-
oriented investments, and U.S. and non-U.S. securities.
Investment types, including high-yield versus investment-grade