IBM 1998 Annual Report Download - page 91
Download and view the complete annual report
Please find page 91 of the 1998 IBM annual report below. You can navigate through the pages in the report by either clicking on the pages listed below, or by using the keyword search tool below to find specific information within the annual report.-
 1
1 -
2
-
3
-
4
-
5
-
6
-
7
-
8
-
9
-
10
-
11
-
12
-
13
-
14
-
15
-
16
-
17
-
18
-
19
-
20
-
21
-
22
-
23
-
24
-
25
-
26
-
27
-
28
-
29
-
30
-
31
-
32
-
33
-
34
-
35
-
36
-
37
-
38
-
39
-
40
-
41
-
42
-
43
-
44
-
45
-
46
-
47
-
48
-
49
-
50
-
51
-
52
-
53
-
54
-
55
-
56
-
57
-
58
-
59
-
60
-
61
-
62
-
63
-
64
-
65
-
66
-
67
-
68
-
69
-
70
-
71
-
72
-
73
-
74
-
75
-
76
-
77
-
78
-
79
-
80
-
 81
81 -
 82
82 -
 83
83 -
 84
84 -
 85
85 -
 86
86 -
 87
87 -
 88
88 -
 89
89 -
 90
90 -
 91
91 -
 92
92 -
 93
93 -
 94
94 -
 95
95 -
 96
96
 |
 |

NOTES TO CONSOLIDATED FINANCIAL STATEMENTS International Business Machines Corporation and Subsidiary Companies
89
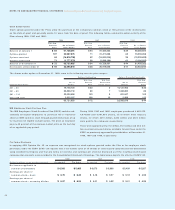
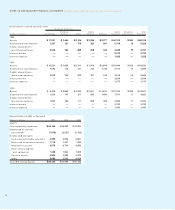
In addition to the previous information for the company’s busi-
ness segments, the following information is provided to
enhance the understanding of the Global Financing segment.
This data summarizes the Global Financing segment’s finan-
cial statements for 1998, 1997 and 1996, respectively.
STATEMENT OF FINANCIAL POSITION
(Dollars in millions)
At December 31: 1998 1997 1996
Assets:
Cash and cash
equivalents $«««1,032 $««««««998 $«««1,433
Net investment in
capital leases 14,456 13,831 13,430
Working capital
financing receivables 5,798 4,928 4,030
Loans receivable 8,682 6,951 6,428
Inventories 119 111 98
Equipment on operating
leases and other property,
net of accumulated
depreciation 5,663 5,168 3,988
Other assets 4,359 3,457 2,386
Total assets $«40,109 $«35,444 $«31,793
Liabilities and stockholders’ equity:
Taxes, accrued expenses
and other liabilities $«««8,077 $«««7,969 $«««7,915
Debt 27,754 23,824 20,627
Total liabilities 35,831 31,793 28,542
Stockholders’ equity/
invested capital 4,278 3,651 3,251
Total liabilities and
stockholders’ equity $«40,109 $«35,444 $«31,793
NET INCOME
(Dollars in millions)
For the year ended December 31: 1998 1997 1996
Net income before
income taxes $«««1,165 $«««1,131 $«««1,260
Provision for income taxes 432 429 531
Net income $««««««733 $««««««702 $««««««729
Return on equity 19.1% 20.3% 22.7%
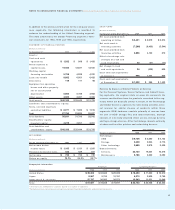
CASH FLOWS
(Dollars in millions)
For the year ended December 31: 1998 1997 1996
Net cash provided from
operating activities $«4,441 $«3,919 $«5,314
Net cash used in
investing activities (7,296) (8,435) (5,544)
Net cash provided from
financing activities 2,856 4,102 872
Effect of exchange rate
changes on cash and
cash equivalents 33 (21) (17)
Net change in cash
and cash equivalents 34 (435) 625
Cash and cash equivalents
at January 1 998 1,433 808
Cash and cash equivalents
at December 31 $«1,032 $÷÷998 $«1,433
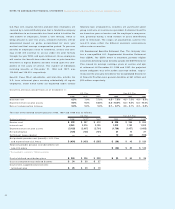
Revenue by Classes of Similar Products or Services
For the Personal Systems, Server, Software and Global Financ-
ing segments, the segment data on page 86 represents the
revenue contributions from the products contained in the seg-
ments which are basically similar in nature. In the Technology
and Global Services segments the table below provides exter-
nal revenue for similar classes of products within those
segments. OEM hardware consists primarily of revenue from
the sale of HDD storage files and semiconductors. Storage
consists of externally attached direct access storage devices
and tape storage devices. Other technology consists primarily
of advanced function printers and networking devices.
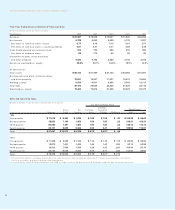
Consolidated
(Dollars in millions) 1998 1997 1996
Technology:
OEM $«6,756 $«5,560 $«4,123
Storage 2,439 2,644 2,716
Other technology 2,695 2,879 3,405
Global Services:
Services 23,730 19,534 16,218
Maintenance 5,186 5,632 6,092
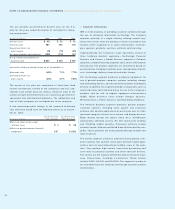
Geographic Information
Revenue* Long-lived Assets**
(Dollars in millions) 1998 1997 1996 1998 1997 1996
United States $«35,303 $«32,663 $«29,395 $«18,450 $«17,802 $«16,910
Japan 8,567 9,765 10,181 4,310 3,635 3,765
Other non-U.S. countries 37,797 36,080 36,371 12,343 11,621 11,648
Total $«81,667 $«78,508 $«75,947 $«35,103 $«33,058 $«32,323
*Revenues are attributed to countries based on location of customer.
**Includes all non-current assets except non-current financial instruments and deferred tax assets.