IBM 1998 Annual Report Download - page 49
Download and view the complete annual report
Please find page 49 of the 1998 IBM annual report below. You can navigate through the pages in the report by either clicking on the pages listed below, or by using the keyword search tool below to find specific information within the annual report.-
 1
1 -
2
-
3
-
4
-
5
-
6
-
7
-
8
-
9
-
10
-
11
-
12
-
13
-
14
-
15
-
16
-
17
-
18
-
19
-
20
-
21
-
22
-
23
-
24
-
25
-
26
-
27
-
28
-
29
-
30
-
31
-
32
-
33
-
34
-
35
-
36
-
37
-
38
-
 39
39 -
 40
40 -
 41
41 -
 42
42 -
 43
43 -
 44
44 -
 45
45 -
 46
46 -
 47
47 -
 48
48 -
 49
49 -
 50
50 -
 51
51 -
 52
52 -
 53
53 -
 54
54 -
 55
55 -
 56
56 -
 57
57 -
 58
58 -
 59
59 -
60
-
61
-
62
-
63
-
64
-
65
-
66
-
67
-
68
-
69
-
70
-
71
-
72
-
73
-
74
-
75
-
76
-
77
-
78
-
79
-
80
-
81
-
82
-
83
-
84
-
85
-
86
-
87
-
88
-
89
-
90
-
91
-
92
-
93
-
94
-
95
-
96
 |
 |
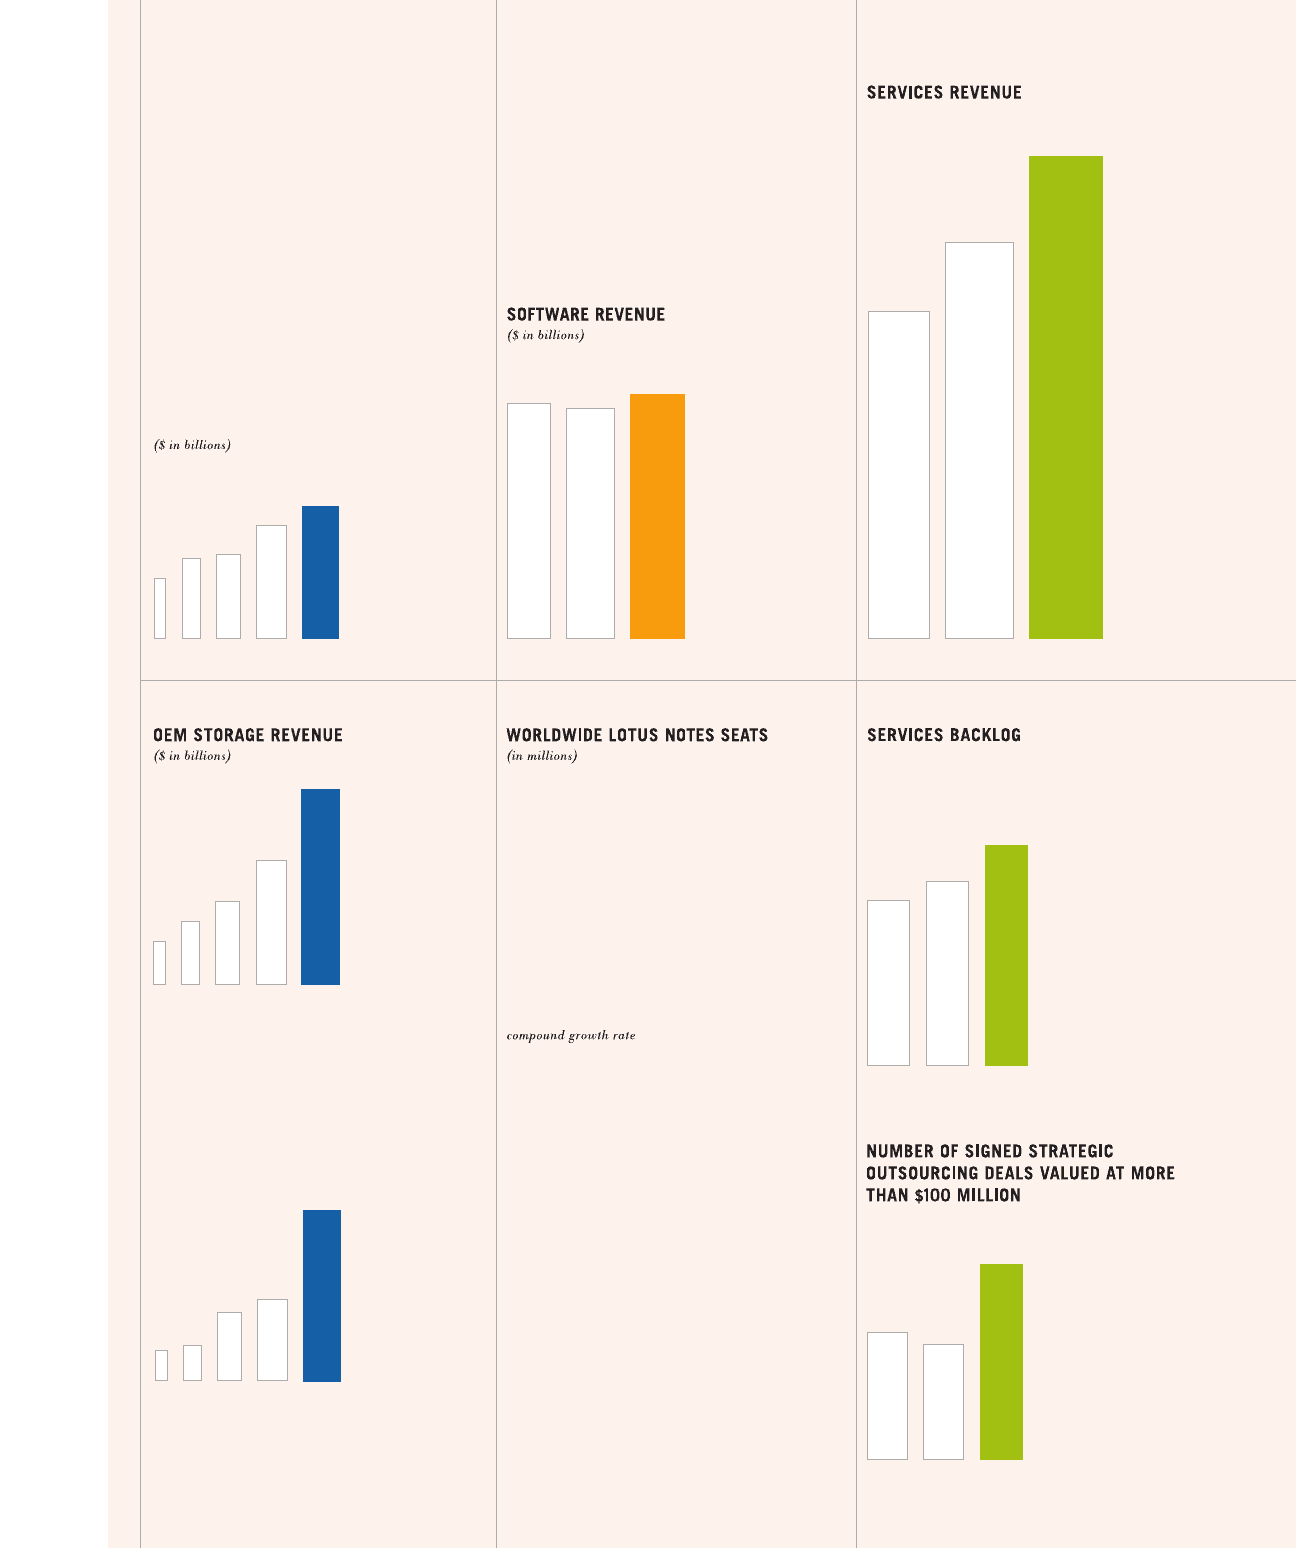
’94 ’95 ’96 ’97 ’98
$6.8
$5.6
$4.1
$4.0
$2.8
’94 ’95 ’96 ’97 ’98
$4.1
$2.7
$1.9
$1.5
$1.1
1. 3 5 4.5 9.3 20 34
’94 ’95 ’96 ’97 ’98
$11.4 $11.2
$11.9
’96 ’97 ’98
$16.2
$19.5
$23.7
’96 ’97 ’98
54%
13 %
Estimated industry
average
$38
$43
$51
’96 ’97 ’98
’96 ’97 ’98
26 24
38
TOTAL OEM HARDWARE REVENUE
83%
27 %
Estimated industry
average
TIVOLI DISTRIBUTED SYSTEMS
MANAGEMENT PERCENTAGE REVENUE
GROWTH (19 96 -199 8)
DISTRIBUTED DATABASE M ANAGEMENT
REVENUE GROWTH (1997-199 8)
Excluding maintenance.
($ in billions)
Excluding maintenance.
End of year, excluding maintenance.
Backlog represents the total amount
of revenue remaining on signed contracts.
($ in billions)
’94 ’95 ’96 ’97 ’98
158
77
64
32
29
Since 1994, the number of customer designs in
ASICs (Application-Specific Integrated Circuits)
has grown at an annual rate of 52 percent.
NUMBER OF OEM CUSTOMER
DESIGNS IN ASICs
engines of
growth
47