IBM 1998 Annual Report Download - page 59
Download and view the complete annual report
Please find page 59 of the 1998 IBM annual report below. You can navigate through the pages in the report by either clicking on the pages listed below, or by using the keyword search tool below to find specific information within the annual report.-
 1
1 -
2
-
3
-
4
-
5
-
6
-
7
-
8
-
9
-
10
-
11
-
12
-
13
-
14
-
15
-
16
-
17
-
18
-
19
-
20
-
21
-
22
-
23
-
24
-
25
-
26
-
27
-
28
-
29
-
30
-
31
-
32
-
33
-
34
-
35
-
36
-
37
-
38
-
39
-
40
-
41
-
42
-
43
-
44
-
45
-
46
-
47
-
48
-
 49
49 -
 50
50 -
 51
51 -
 52
52 -
 53
53 -
 54
54 -
 55
55 -
 56
56 -
 57
57 -
 58
58 -
 59
59 -
 60
60 -
 61
61 -
 62
62 -
 63
63 -
 64
64 -
 65
65 -
 66
66 -
 67
67 -
 68
68 -
 69
69 -
70
-
71
-
72
-
73
-
74
-
75
-
76
-
77
-
78
-
79
-
80
-
81
-
82
-
83
-
84
-
85
-
86
-
87
-
88
-
89
-
90
-
91
-
92
-
93
-
94
-
95
-
96
 |
 |

in 1997 from 1996. The increase reflects the company’s
continued investments in high-growth opportunities like
e-business, Java, Tivoli systems management and HDD prod-
ucts, as well as the impact of additional expenses associated
with new acquisitions. The decline in 1997 versus 1996 was a
result of $435 million of purchased in-process research and
development being recorded in 1996 for the Tivoli and Object
Technology International, Inc. acquisitions.
The company’s ongoing research and development efforts
have resulted in the company being granted 2,658 patents in
1998, placing it number one in patents granted in the U.S. for
the sixth consecutive year. The application of these techno-
logical advances has enabled the company to transform this
research and development into new products. Examples of
these efforts are numerous patents directly related to two
major chip breakthroughs announced last year, silicon germa-
nium and silicon-on-insulator. Both technologies will be cru-
cial in the industry’s development of a new class of “pervasive
computing” devices, handheld and embedded products such
as smart phones and internet appliances that business
professionals and consumers will rely on for easy access to
e-business data and services. In addition, the use of copper in
place of aluminum in the making of integrated circuits was
introduced into new products in 1998.
On a constant currency basis, SG&A expense increased
approximately 2.1 percent in 1998 versus 1997, and Research,
development and engineering expense increased approxi-
mately 3.9 percent.
See note Y, “Segment Information,” on pages 84 through 89
for additional information regarding each segment’s pre-tax
income, as well as the methodologies employed by the com-
pany to allocate shared expenses to the segments.
Provision for Income Taxes
The provision for income taxes resulted in an effective tax rate
of 30 percent for 1998, as compared to the 1997 effective tax
rate of 33 percent and a 1996 effective tax rate of 37 percent.
Adjusting for purchased in-process research and development
which had no corresponding tax effect, the 1996 effective tax
rate would have been 35 percent. The reduction in the 1998 and
1997 tax rate reflects the company’s continued expansion into
markets with lower effective tax rates.
The company accounts for income taxes under Statement of
Financial Accounting Standards (SFAS) 109, “Accounting for
Income Taxes,” which provides that a valuation allowance
should be recognized to reduce the deferred tax asset to the
amount that is more likely than not to be realized. In assessing
the likelihood of realization, management considered esti-
mates of future taxable income, which are based primarily on
recent financial performance.
57
MANAGEMENT DISCUSSION International Business Machines Corporation and Subsidiary Companies
growth in the more competitive U.S. markets. See note Y,
“Segment Information,” on pages 84 through 89 for more
detailed information on the Global Financing segment.
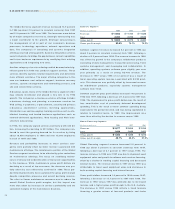
Enterprise Investments Segment/Other
(Dollars in millions) 1998 1997 1996
Revenue $«2,592 $«2,742 $«2,523
Cost 1,702 1,729 1,823
Gross profit $««««890 $«1,013 $««««700
Gross profit margin 34.3% 36.9% 27.7%
Information, including a description of the company’s Enterprise
Investment segment, can be found in note Y, “Segment Infor-
mation,” on pages 84 through 89.
The revenue from the Enterprise Investments segment /Other
decreased 5.5 percent (down about 3 percent in constant cur-
rency) from 1997, following an increase of 8.7 percent in 1997
from 1996. The decrease was primarily a result of lower soft-
ware revenue, partially offset by higher revenue from point-of-
sale terminals. The increase in 1997 versus 1996 was driven by
higher software and point-of-sale terminal revenue. The gross
profit dollars from the Enterprise Investments segment /Other
decreased 12.1 percent in 1998 versus 1997, following an
increase of 44.7 percent in 1997 versus 1996. The decline in
1998 gross profit dollars was primarily driven by the lower
software revenue versus 1997, while the increase in 1997 versus
1996 was due to lower software costs.
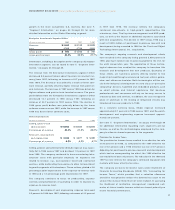
Operating Expenses
(Dollars in millions) 1998 1997 1996
Selling, general and
administrative $«16,662 $«16,634 $«16,854
Percentage of revenue 20.4% 21.2% 22.2%
Research, development
and engineering $«««5,046 $«««4,877 $«««5,089
Percentage of revenue 6.2% 6.2% 6.7%
Selling, general and administrative (SG&A) expense was essen-
tially flat in 1998 versus 1997 and declined 1.3 percent in 1997
from 1996. The company continued its focus on reducing infra-
structure costs with particular emphasis on expenses not
related to revenue, e.g., non-customer travel and contracted
services, while reallocating its resources to allow for investment
in growth segments of the business. These actions yielded a 0.8
percentage point improvement in the expense-to-revenue ratio
in 1998 and a 1.0 percentage point improvement in 1997.
The company continues to focus on productivity, expense
controls and prioritization of spending in order to improve its
expense-to-revenue level.
Research, development and engineering expense increased
3.5 percent in 1998 from 1997, following a decrease of 4.2 percent