IBM 1998 Annual Report Download - page 57
Download and view the complete annual report
Please find page 57 of the 1998 IBM annual report below. You can navigate through the pages in the report by either clicking on the pages listed below, or by using the keyword search tool below to find specific information within the annual report.-
 1
1 -
2
-
3
-
4
-
5
-
6
-
7
-
8
-
9
-
10
-
11
-
12
-
13
-
14
-
15
-
16
-
17
-
18
-
19
-
20
-
21
-
22
-
23
-
24
-
25
-
26
-
27
-
28
-
29
-
30
-
31
-
32
-
33
-
34
-
35
-
36
-
37
-
38
-
39
-
40
-
41
-
42
-
43
-
44
-
45
-
46
-
 47
47 -
 48
48 -
 49
49 -
 50
50 -
 51
51 -
 52
52 -
 53
53 -
 54
54 -
 55
55 -
 56
56 -
 57
57 -
 58
58 -
 59
59 -
 60
60 -
 61
61 -
 62
62 -
 63
63 -
 64
64 -
 65
65 -
 66
66 -
 67
67 -
68
-
69
-
70
-
71
-
72
-
73
-
74
-
75
-
76
-
77
-
78
-
79
-
80
-
81
-
82
-
83
-
84
-
85
-
86
-
87
-
88
-
89
-
90
-
91
-
92
-
93
-
94
-
95
-
96
 |
 |

55
MANAGEMENT DISCUSSION International Business Machines Corporation and Subsidiary Companies
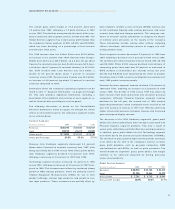
The overall gross profit margin at 37.8 percent decreased
1.2 points from 1997, following a 1.2 point decrease in 1997
versus 1996. The declines were primarily the result of the com-
pany’s continued shift to global services in 1998 and 1997. The
Global Services segment has a lower gross profit margin than
the company’s Server segment (S/390, AS/400 and RS/6000),
which has been declining as a percentage of total revenue
over the past three years.
The 1998 revenue from the United States was $35.3 billion,
an increase of 8.1 percent from 1997. Revenue from Europe/
Middle East /Africa was $26.0 billion, up 8.6 percent (up about
9 percent in constant currency). Asia Pacific revenue fell 9.4 per-
cent (down about 1 percent in constant currency) to $13.8 bil-
lion, while revenue from Latin America was $3.3 billion, a
decline of 9.2 percent (down about 7 percent in constant
currency) versus 1997. Revenue from Canada was $3.3 billion,
an increase of 6.8 percent (up about 14 percent in constant
currency) compared to 1997.
Information about the company’s operating segments can be
found in note Y, “Segment Information,” on pages 84 through
89. This note provides additional information, including a
description of the products and services of each segment, as
well as financial data pertaining to each segment.
The following discussion is based on the Consolidated
Financial Statements found on pages 64 through 68, which
reflect, in all material respects, the company’s segment results
on an external basis.
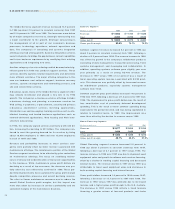
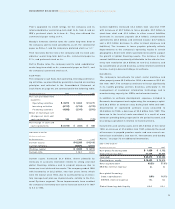
Hardware Segments
(Dollars in millions) 1998 1997 1996
Revenue $«35,419 $«36,630 $«36,634
Cost 24,214 23,473 22,888
Gross profit $«11,205 $«13,157 $«13,746
Gross profit margin 31.6% 35.9% 37.5%
Revenue from Hardware segments decreased 3.3 percent
(down about 2 percent in constant currency) from 1997, after
being essentially flat in 1997 versus 1996. Gross profit dollars
from Hardware segments declined 14.8 percent from 1997,
following a decrease of 4.3 percent in 1997 from 1996.
Technology segment revenue increased 7.3 percent in 1998
versus 1997, following an increase of 8.2 percent in 1997 com-
pared to 1996. The increases were driven by continued strong
growth in HDD storage products, which are primarily sold to
Original Equipment Manufacturers (OEMs) for use in their
product offerings, storage tape products, and growth in cus-
tom logic products. These increases were partially offset by
lower dynamic random access memory (DRAM) revenue due
to the continued industry-wide pricing pressures and lower
revenue from high-end storage products. The company con-
tinues to evaluate various alternatives to mitigate the impact
of memory price pressures on the results of the company.
These alternatives include, among other actions, realigning
alliance structures, rebalancing sources of supply and redi-
recting product focus.
Server segment revenue decreased 5.9 percent in 1998 from
1997, following a decrease of 7.7 percent in 1997 versus 1996.
The declines were driven by lower revenue from S/390, AS/400
and RS/6000. While S/390 revenue declined, total delivery of
computing power increased over 60 percent as measured in
MIPS (millions of instructions per second) versus last year.
AS/400 and RS/6000 were impacted by the effect of product
transitions late in 1998, as well as anticipation by customers of
early 1999 product announcements.
Personal Systems segment revenue declined 10.9 percent in
1998 from 1997, following an increase of 3.3 percent in 1997
versus 1996. The decline in 1998 versus 1997 was driven by
lower revenue from both commercial and consumer personal
computers. Although Personal Systems segment revenue
declined for the full year, the second half of 1998 showed
improved performance when compared to the first half of the
year. The increase in revenue in 1997 over 1996 was driven by
higher commercial personal computer revenue and increased
general-purpose display revenue.
The decrease in the 1998 Hardware segments’ gross profit
dollars was driven primarily by lower margins associated with
Personal Systems segment products. This was a result of
severe price reductions, partially offset by cost improvements.
In addition, gross profit dollars for the Technology segment
were lower due to the year-to-year price reductions in DRAMs.
The decrease in gross profit margin over the periods continues
to be driven by the shift in the company’s revenue to lower
gross profit products, such as personal computers, OEM
semiconductors and HDDs, as well as price pressures. The
overall Hardware segments’ gross profit dollars and margin
continue to be adversely impacted by pricing pressures
across most products.
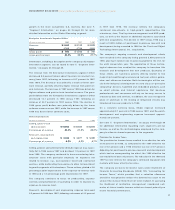
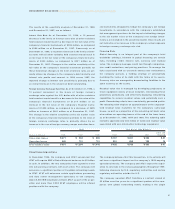
Global Services Segment
(Dollars in millions) 1998 1997 1996
Revenue $«28,916 $«25,166 $«22,310
Cost 21,125 18,464 16,270
Gross profit $«««7,791 $«««6,702 $«««6,040
Gross profit margin 26.9% 26.6% 27.1%