IBM 1998 Annual Report Download - page 61
Download and view the complete annual report
Please find page 61 of the 1998 IBM annual report below. You can navigate through the pages in the report by either clicking on the pages listed below, or by using the keyword search tool below to find specific information within the annual report.-
 1
1 -
2
-
3
-
4
-
5
-
6
-
7
-
8
-
9
-
10
-
11
-
12
-
13
-
14
-
15
-
16
-
17
-
18
-
19
-
20
-
21
-
22
-
23
-
24
-
25
-
26
-
27
-
28
-
29
-
30
-
31
-
32
-
33
-
34
-
35
-
36
-
37
-
38
-
39
-
40
-
41
-
42
-
43
-
44
-
45
-
46
-
47
-
48
-
49
-
50
-
 51
51 -
 52
52 -
 53
53 -
 54
54 -
 55
55 -
 56
56 -
 57
57 -
 58
58 -
 59
59 -
 60
60 -
 61
61 -
 62
62 -
 63
63 -
 64
64 -
 65
65 -
 66
66 -
 67
67 -
 68
68 -
 69
69 -
 70
70 -
 71
71 -
72
-
73
-
74
-
75
-
76
-
77
-
78
-
79
-
80
-
81
-
82
-
83
-
84
-
85
-
86
-
87
-
88
-
89
-
90
-
91
-
92
-
93
-
94
-
95
-
96
 |
 |

59
MANAGEMENT DISCUSSION International Business Machines Corporation and Subsidiary Companies
Poor’s upgraded its credit ratings for the company and its
rated subsidiaries’ senior long-term debt to A+ from A, and on
IBM’s preferred stock to A from A-. They also affirmed the
commercial paper rating at A-1.
Moody’s Investors Service rates the senior long-term debt of
the company and its rated subsidiaries as A1, the commercial
paper as Prime-1, and the company’s preferred stock as “a1.”
Fitch Investors Service rates the company and its rated sub-
sidiaries’ senior long-term debt as AA-, commercial paper as
F-1+, and preferred stock as A+.
Duff & Phelps rates the company and its rated subsidiaries’
senior long-term debt as A+, commercial paper as Duff 1, and
the company’s preferred stock as A.
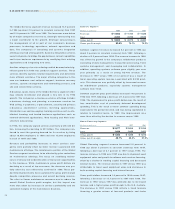
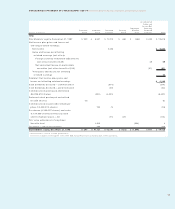
Cash Flows
The company’s cash flows from operating, investing and financ-
ing activities, as prescribed by generally accepted accounting
principles and reflected in the Consolidated Statement of
Cash Flows on page 68, are summarized in the following table:
(Dollars in millions) 1998 1997 1996
Net cash provided from
(used in):
Operating activities $««9,273 $«««8,865 $«10,275
Investing activities (6,131) (6,155) (5,723)
Financing activities (4,993) (3,090) (3,952)
Effect of exchange rate
changes on cash and
cash equivalents 120 (201) (172)
Net change in cash and
cash equivalents $«(1,731) $«««««(581) $÷÷÷428
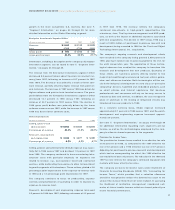
WORKING CAPITAL
(Dollars in millions)
At December 31: 1998 1997
Current assets $«42,360 $«40,418
Current liabilities 36,827 33,507
Working capital $÷«5,533 $«««6,911
Current ratio 1.15:1 1.21:1
Current assets increased $1.9 billion, driven primarily by
increases in accounts receivable relative to strong year-end
global financing volumes and in prepaid expenses due to
increases in net deferred tax assets. The company ended 1998
with inventories of $5.2 billion, near last year’s levels which
were the lowest since 1983, due to continued focus on inven-
tory management process improvements, notably in the Per-
sonal Systems segment. These improvements have enabled
the company’s inventory turn rate to increase from 4.9 in 1997
to 5.3 in 1998.
Current liabilities increased $3.3 billion from year-end 1997
with increases of $0.7 billion in taxes payable, $0.7 billion in
short-term debt and $1.9 billion in other current liabilities
(increases in accounts payable ($1.0 billion), compensation
and benefits ($0.5 billion), and deferred income ($0.7 billion),
and a $0.3 billion decrease in other accrued expenses and
liabilities). The increase in taxes payable primarily reflects
improvements in the company’s operating results in certain
geographies. Short-term debt essentially increased to support
the growth of global financing assets. The increase in other
current liabilities was primarily attributable to the effect of cur-
rency rate translation ($1.0 billion) on non-U.S. balances, and
by considerable year-end business activity relative to deferred
income, mainly advanced billings for software.
Investments
The company’s investments for plant, rental machines and
other property were $6.5 billion for 1998, a decrease of $0.3 bil-
lion from 1997. The company continues to invest significantly
in its rapidly growing services business, principally in the
management of customers’ information technology, and in
manufacturing capacity for HDDs and microelectronics.
In addition to software development expenses included in
Research, development and engineering, the company capital-
ized $0.3 billion of software costs during both 1998 and 1997.
Amortization of capitalized software costs amounted to
$0.5 billion for 1998, a decrease of $0.5 billion from 1997. This
decrease in the level of costs amortized is a result of more
software spending being expensed in the period incurred, and
less being capitalized in relation to historical levels.
Investments and sundry assets were $23.5 billion at the end of
1998, an increase of $1.6 billion from 1997, primarily the result
of increases in prepaid pension assets and non-current cus-
tomer loan receivables. See note H, “Investments and Sundry
Assets,” on page 72 for additional information.
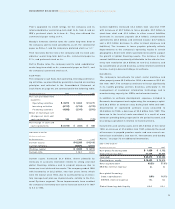
DEBT AND EQUITY
(Dollars in millions) 1998 1997
Non-global financing debt $÷«1,659 $«««3,102
Global financing debt 27,754 23,824
Total debt $«29,413 $«26,926
Stockholders’ equity $«19,433 $«19,816
Debt /capitalization 60.2% 57.6%
EBITDA/interest expense 8x 8x
Non-global financing:
Debt /capitalization 9.9% 16.1%
EBITDA/interest expense 15x 14x
Global financing debt /equity 6.5:1 6.5:1