IBM 1998 Annual Report Download - page 70
Download and view the complete annual report
Please find page 70 of the 1998 IBM annual report below. You can navigate through the pages in the report by either clicking on the pages listed below, or by using the keyword search tool below to find specific information within the annual report.-
 1
1 -
2
-
3
-
4
-
5
-
6
-
7
-
8
-
9
-
10
-
11
-
12
-
13
-
14
-
15
-
16
-
17
-
18
-
19
-
20
-
21
-
22
-
23
-
24
-
25
-
26
-
27
-
28
-
29
-
30
-
31
-
32
-
33
-
34
-
35
-
36
-
37
-
38
-
39
-
40
-
41
-
42
-
43
-
44
-
45
-
46
-
47
-
48
-
49
-
50
-
51
-
52
-
53
-
54
-
55
-
56
-
57
-
58
-
59
-
 60
60 -
 61
61 -
 62
62 -
 63
63 -
 64
64 -
 65
65 -
 66
66 -
 67
67 -
 68
68 -
 69
69 -
 70
70 -
 71
71 -
 72
72 -
 73
73 -
 74
74 -
 75
75 -
 76
76 -
 77
77 -
 78
78 -
 79
79 -
 80
80 -
81
-
82
-
83
-
84
-
85
-
86
-
87
-
88
-
89
-
90
-
91
-
92
-
93
-
94
-
95
-
96
 |
 |

68
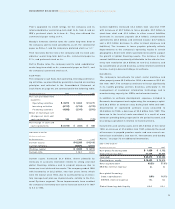
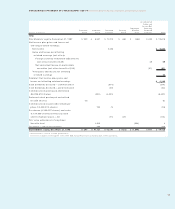
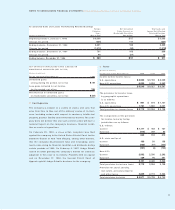
CONSOLIDATED STATEMENT OF CASH FLOWS International Business Machines Corporation and Subsidiary Companies
(Dollars in millions)
For the year ended December 31: 1998 1997 1996*
Cash flow from operating activities:
Net income $«6,328 $«6,093 $«5,429
Adjustments to reconcile net income to cash provided
from operating activities:
Depreciation 4,475 4,018 3,676
Amortization of software 517 983 1,336
Effect of restructuring charges (355) (445) (1,491)
Deferred income taxes (606) 358 11
Gain on disposition of fixed and other assets (261) (273) (300)
Other changes that (used) provided cash:
Receivables (2,736) (3,727) (650)
Inventories 73 432 196
Other assets 880 (1,087) (545)
Accounts payable 362 699 319
Other liabilities 596 1,814 2,294
Net cash provided from operating activities 9,273 8,865 10,275
Cash flow from investing activities:
Payments for plant, rental machines and other property (6,520) (6,793) (5,883)
Proceeds from disposition of plant, rental machines
and other property 905 1,130 1,314
Acquisition of Tivoli Systems, Inc. —— (716)
Investment in software (250) (314) (295)
Purchases of marketable securities and other investments (4,211) (1,617) (1,613)
Proceeds from marketable securities and other investments 3,945 1,439 1,470
Net cash used in investing activities (6,131) (6,155) (5,723)
Cash flow from financing activities:
Proceeds from new debt 7,567 9,142 7,670
Short-term borrowings less than 90 days— net 499 (668) (919)
Payments to settle debt (5,942) (4,530) (4,992)
Preferred stock transactions—net (5) (1) —
Common stock transactions—net (6,278) (6,250) (5,005)
Cash dividends paid (834) (783) (706)
Net cash used in financing activities (4,993) (3,090) (3,952)
Effect of exchange rate changes on cash and cash equivalents 120 (201) (172)
Net change in cash and cash equivalents (1,731) (581) 428
Cash and cash equivalents at January 1 7,106 7,687 7,259
Cash and cash equivalents at December 31 $«5,375 $«7,106 $«7,687
Supplemental data:
Cash paid during the year for:
Income taxes $«1,929 $«2,472 $«2,229
Interest $«1,605 $«1,475 $«1,563
*Reclassified to conform to 1998 presentation.
The notes on pages 69 through 89 of the 1998 IBM Annual Report are an integral part of this statement.