IBM 1998 Annual Report Download - page 75
Download and view the complete annual report
Please find page 75 of the 1998 IBM annual report below. You can navigate through the pages in the report by either clicking on the pages listed below, or by using the keyword search tool below to find specific information within the annual report.-
 1
1 -
2
-
3
-
4
-
5
-
6
-
7
-
8
-
9
-
10
-
11
-
12
-
13
-
14
-
15
-
16
-
17
-
18
-
19
-
20
-
21
-
22
-
23
-
24
-
25
-
26
-
27
-
28
-
29
-
30
-
31
-
32
-
33
-
34
-
35
-
36
-
37
-
38
-
39
-
40
-
41
-
42
-
43
-
44
-
45
-
46
-
47
-
48
-
49
-
50
-
51
-
52
-
53
-
54
-
55
-
56
-
57
-
58
-
59
-
60
-
61
-
62
-
63
-
64
-
 65
65 -
 66
66 -
 67
67 -
 68
68 -
 69
69 -
 70
70 -
 71
71 -
 72
72 -
 73
73 -
 74
74 -
 75
75 -
 76
76 -
 77
77 -
 78
78 -
 79
79 -
 80
80 -
 81
81 -
 82
82 -
 83
83 -
 84
84 -
 85
85 -
86
-
87
-
88
-
89
-
90
-
91
-
92
-
93
-
94
-
95
-
96
 |
 |

NOTES TO CONSOLIDATED FINANCIAL STATEMENTS International Business Machines Corporation and Subsidiary Companies
73
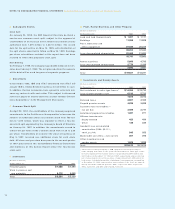
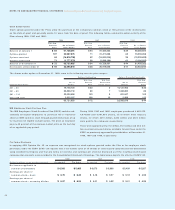
ILines of Credit
The company maintains a $10.0 billion committed global credit
facility. Unused committed lines of credit from this global facil-
ity amounted to $8.8 billion and $9.2 billion at December 31,
1998 and 1997, respectively. The company’s other committed
and uncommitted lines of credit amounted to $5.2 billion at
December 31, 1998 and 1997. The unused portion of those
lines amounted to $4.3 billion and $3.9 billion at December 31,
1998 and 1997, respectively. Total unused lines of credit at
December 31, 1998 and 1997, amounted to $13.1 billion.
Interest rates on borrowings vary from country to country
depending on local market conditions.
JSale and Securitization of Receivables
At year-end 1998 and 1997, the company had a net balance of
$0.9 billion in assets under management from the securitiza-
tion of loans, leases and trade receivables. The company
received total cash proceeds of approximately $2.4 billion and
$3.0 billion in 1998 and 1997, respectively, from the sale and
securitization of these receivables and assets. No material
gain or loss resulted from these transactions. Recourse
amounts associated with the aforementioned sale and securi-
tization activities are expected to be minimal, and adequate
reserves are in place to cover potential losses.
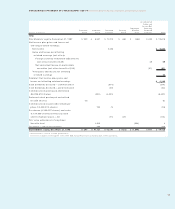
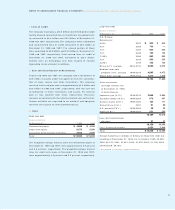
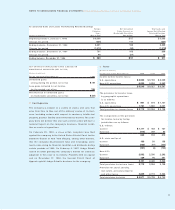
KDebt
Short-term debt
(Dollars in millions)
At December 31: 1998 1997
Commercial paper $«««4,885 $«««4,583
Short-term loans 6,370 5,699
Long-term debt: Current maturities 2,650 2,948
Total $«13,905 $«13,230
The weighted-average interest rates for commercial paper at
December 31, 1998 and 1997, were approximately 5.7 percent
and 5.8 percent, respectively. The weighted-average interest
rates for short-term loans at December 31, 1998 and 1997,
were approximately 5.3 percent and 5.5 percent, respectively.
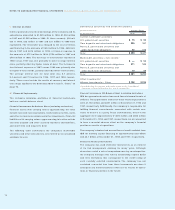
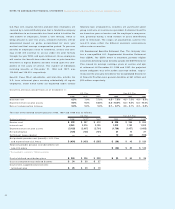
Long-term debt
(Dollars in millions)
At December 31: Maturities 1998 1997*
U.S. Dollars:
Debentures:
6.22% 2027 $««««««500 $««««««500
6.5% 2028 700 —
7.0% 2025 600 600
7.0% 2045 150 150
7.125% 2096 850 850
7.5% 2013 550 550
8.375% 2019 750 750
Notes: 6.7% average 2000-2013 2,695 2,674
Medium-term note
program: 5.8% average 1999-2013 4,885 4,472
Other: 6.5% average 1999-2012 1,514 1,319
13,194 11,865
Other currencies
(average interest rate
at December 31, 1998,
in parentheses):
Japanese yen (3.1% ) 1999-2014 3,866 3,944
Canadian dollars (5.7% ) 1999-2003 672 407
German marks (4.9% ) 1999-2002 120 111
Swiss francs (2.5% ) 2001 91 85
U.K. pounds (7.9% ) 1999-2004 25 28
Other (11.9% ) 1999-2026 221 235
18,189 16,675
Less: Net unamortized
discount 31 31
18,158 16,644
Less: Current maturities 2,650 2,948
Total $«15,508 $«13,696
Annual maturities in millions of dollars on long-term debt out-
standing at December 31, 1998, are as follows: 1999, $2,650;
2000, $5,120; 2001, $1,491; 2002, $1,676; 2003, $1,116; 2004
and beyond, $6,136.
*Reclassified to conform to 1998 presentation.