IBM 1998 Annual Report Download - page 58
Download and view the complete annual report
Please find page 58 of the 1998 IBM annual report below. You can navigate through the pages in the report by either clicking on the pages listed below, or by using the keyword search tool below to find specific information within the annual report.-
 1
1 -
2
-
3
-
4
-
5
-
6
-
7
-
8
-
9
-
10
-
11
-
12
-
13
-
14
-
15
-
16
-
17
-
18
-
19
-
20
-
21
-
22
-
23
-
24
-
25
-
26
-
27
-
28
-
29
-
30
-
31
-
32
-
33
-
34
-
35
-
36
-
37
-
38
-
39
-
40
-
41
-
42
-
43
-
44
-
45
-
46
-
47
-
 48
48 -
 49
49 -
 50
50 -
 51
51 -
 52
52 -
 53
53 -
 54
54 -
 55
55 -
 56
56 -
 57
57 -
 58
58 -
 59
59 -
 60
60 -
 61
61 -
 62
62 -
 63
63 -
 64
64 -
 65
65 -
 66
66 -
 67
67 -
 68
68 -
69
-
70
-
71
-
72
-
73
-
74
-
75
-
76
-
77
-
78
-
79
-
80
-
81
-
82
-
83
-
84
-
85
-
86
-
87
-
88
-
89
-
90
-
91
-
92
-
93
-
94
-
95
-
96
 |
 |

The Global Services segment revenue increased 14.9 percent
in 1998 (up about 18 percent in constant currency) from 1997
and 12.8 percent in 1997 over 1996. The increases were driven
by all major categories of services. Strategic outsourcing was
a major contributor to the growth. Strategic outsourcing is
the management of all or part of our customer’s business
processes, technology operations, network operations and
data. The company’s IT consulting and systems integration
offerings also had strong growth. Systems integration services
assist companies to bridge the gap between current capabilities
and future business requirements by modifying their existing
applications and integrating new ones.
Another category of service offerings which demonstrated sig-
nificant growth in 1998 was product support services. These
services identify systems-related requirements and determine
more efficient solutions. The major offering categories in this
area are hardware and software support, business recovery
services, systems management and networking services, and
site and connectivity services.
E-business spans many of the Global Services segment offer-
ings already mentioned and played a key role in its 1998
growth. The company’s e-business services offerings include:
e-business strategy and planning; e-commerce services for
Web selling, e-payments, e-procurement, security and privacy;
e-business enablement services involving applications,
information use and messaging; learning services such as dis-
tributed learning; and hosted business applications such as
network-delivered applications, Web hosting and Web infra-
structure outsourcing.
In 1998, the company signed services contracts worth $33 bil-
lion, increasing the backlog to $51 billion. The company con-
tinued to meet the growing demand for its services by hiring
about 18,000 employees in 1998 and over 15,000 employees
in each of 1997 and 1996.
Revenue and profitability increases in these services cate-
gories were partially offset by lower revenue associated with
maintenance offerings. The maintenance portion of the Global
Services segment continues to be affected by price reductions
on maintenance offerings. The focus on stabilizing mainte-
nance revenues led to identification of many new opportunities
in this business. While maintenance gross profit dollars are
declining as a result of lower revenue, the decrease was par-
tially offset by cost efficiencies achieved in 1998. These pro-
ductivity improvements have sustained the gross profit margin
despite competitive pressures and overall declining revenue.
The effect of lower maintenance revenues was to reduce the
overall Global Services profit margins, but this impact was
more than offset by increases in services profitability and the
sustained margins of the maintenance business.
MANAGEMENT DISCUSSION International Business Machines Corporation and Subsidiary Companies
56
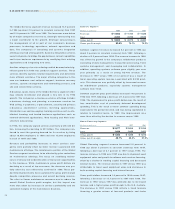
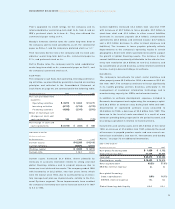
Software Segment
(Dollars in millions) 1998 1997 1996
Revenue $«11,863 $«11,164 $«11,426
Cost 2,260 2,785 2,946
Gross profit $÷«9,603 $«÷8,379 $«««8,480
Gross profit margin 80.9% 75.1% 74.2%
Software segment revenue increased 6.3 percent in 1998 (up
about 9 percent in constant currency) from 1997, following a
decline of 2.3 percent from 1996. The revenue increase in 1998
was driven by growth in the company’s middleware products
consisting of data management, transaction processing, Tivoli
systems management, and messaging and collaboration. In
addition, operating systems software grew slightly year over
year primarily as a result of strong AS/400 revenue. The
decrease in 1997 versus 1996 of 2.3 percent was a result of
lower operating system revenue associated with S/390 prod-
ucts. This decrease was partially offset by increased revenue
for middleware products, especially systems management
software from Tivoli.
Software segment gross profit dollars increased 14.6 percent in
1998 from 1997, following a decrease of 1.2 percent in 1997 from
1996. The improvement in gross profit dollars was the result of
less amortization cost of previously deferred development
spending. This is the result of more software spending being
expensed in the period incurred, and less being capitalized in
relation to historical levels. In 1997, this improvement was
more than offset by the decline in revenue versus 1996.
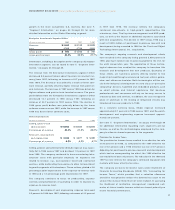
Global Financing Segment
(Dollars in millions) 1998 1997 1996
Revenue $«2,877 $«2,806 $«3,054
Cost 1,494 1,448 1,481
Gross profit $«1,383 $«1,358 $«1,573
Gross profit margin 48.1% 48.4% 51.5%
Global Financing segment revenue increased 2.5 percent in
1998 (up about 5 percent in constant currency) from 1997,
following a decrease of 8.1 percent in 1997 versus 1996. The
revenue increase in 1998 over 1997 was due to improved used
equipment sales and growth in software and services financing,
offset by a decline in working capital financing and decreased
interest income. The revenue decline in 1997 versus 1996 was
attributable to lower used equipment sales and decreases in
both working capital financing and interest income.
Gross profit dollars increased 1.8 percent in 1998 versus 1997,
following a decrease of 13.7 percent in 1997 from 1996. The
increase in 1998 versus 1997 was primarily due to increased
revenue and a higher gross profit margin in the U.S. markets.
The decrease in 1997 versus 1996 reflects a trend towards
financing a greater volume of low-end products and faster