IBM 1998 Annual Report Download - page 83
Download and view the complete annual report
Please find page 83 of the 1998 IBM annual report below. You can navigate through the pages in the report by either clicking on the pages listed below, or by using the keyword search tool below to find specific information within the annual report.-
 1
1 -
2
-
3
-
4
-
5
-
6
-
7
-
8
-
9
-
10
-
11
-
12
-
13
-
14
-
15
-
16
-
17
-
18
-
19
-
20
-
21
-
22
-
23
-
24
-
25
-
26
-
27
-
28
-
29
-
30
-
31
-
32
-
33
-
34
-
35
-
36
-
37
-
38
-
39
-
40
-
41
-
42
-
43
-
44
-
45
-
46
-
47
-
48
-
49
-
50
-
51
-
52
-
53
-
54
-
55
-
56
-
57
-
58
-
59
-
60
-
61
-
62
-
63
-
64
-
65
-
66
-
67
-
68
-
69
-
70
-
71
-
72
-
 73
73 -
 74
74 -
 75
75 -
 76
76 -
 77
77 -
 78
78 -
 79
79 -
 80
80 -
 81
81 -
 82
82 -
 83
83 -
 84
84 -
 85
85 -
 86
86 -
 87
87 -
 88
88 -
 89
89 -
 90
90 -
 91
91 -
 92
92 -
 93
93 -
94
-
95
-
96
 |
 |

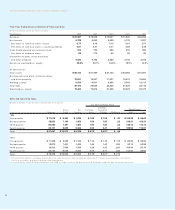
NOTES TO CONSOLIDATED FINANCIAL STATEMENTS International Business Machines Corporation and Subsidiary Companies
81
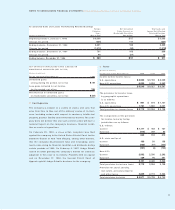
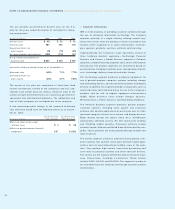
The pro forma amounts, for purposes of SFAS 123, reflect the
portion of the estimated fair value of awards earned in 1998,
1997 and 1996. The aggregate fair value of awards granted is
earned ratably over the vesting or service period and is greater
than that included in the pro forma amounts.
The company used the Black-Scholes model to value the stock
options granted in 1998, 1997 and 1996. The weighted-average
assumptions used to estimate the value of the options included
in the pro forma amounts, and the weighted-average estimated
fair value of an option granted are as follows:
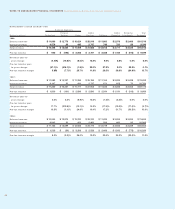
WRetirement Plans
The company and its subsidiaries have defined benefit and defined contribution retirement plans covering substantially all regular
employees, and a supplemental retirement plan that covers certain executives.
The changes in the benefit obligations and plan assets of the U.S. and material non-U.S. defined benefit plans for 1998 and 1997
were as follows:
U.S. Plan Non-U.S. Plans
(Dollars in millions) 1998 1997*1998 1997*
Change in benefit obligation:
Benefit obligation at beginning of year $«33,161 $«29,729 $«18,846 $«19,883
Service cost 532 397 399 366
Interest cost 2,261 2,215 1,213 1,182
Plan participants’ contributions ——29 33
Acquisitions/divestitures, net 22 (2) —129
Amendments —14 2—
Actuarial losses 2,729 2,805 1,331 431
Benefits paid from trust (2,144) (1,997) (683) (623)
Direct benefit payments ——(254) (281)
Foreign exchange impact ——1,155 (2,186)
Plan curtailments/settlements/termination benefits ——10 (88)
Benefit obligation at end of year 36,561 33,161 22,048 18,846
Change in plan assets:
Fair value of plan assets at beginning of year 38,475 34,281 21,841 21,039
Actual return on plan assets 5,240 6,193 2,400 3,454
Employer contribution ——452 192
Acquisitions/divestitures, net 22 (2) —129
Plan participants’ contributions ——29 33
Benefits paid from trust (2,144) (1,997) (683) (623)
Foreign exchange impact ——1,283 (2,263)
Settlements ——(28) (120)
Fair value of plan assets at end of year 41,593 38,475 25,294 21,841
Fair value of plan assets in excess
of benefit obligation 5,032 5,314 3,246 2,995
Unrecognized net actuarial gains (1,289) (1,901) (2,342) (2,897)
Unrecognized prior service costs 174 190 181 194
Unrecognized net transition asset (771) (911) (78) (83)
Adjustment to recognize minimum liability ——(87) (3)
Prepaid pension asset recognized
in the Consolidated Statement of Financial Position $«««3,146 $«««2,692 $««««««920 $««««««206
*Reclassified to conform to 1998 presentation.
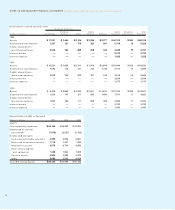
1998 1997 1996
Term (years)*5/6 5/6 5/6
Volatility** 26.4% 23.0% 22.0%
Risk-free interest rate (zero
coupon U.S. treasury note) 5.1% 6.2% 6.0%
Dividend yield 0.8% 1.0% 1.2%
Weighted-average fair
value of options $«36 $«25 $«20
*Option term is based on tax incentive options (5 years) and non-tax
incentive options (6 years).
**To determine volatility, the company measured the daily price changes
of the stock over the most recent 5 and 6 year periods.