IBM 1998 Annual Report Download - page 80
Download and view the complete annual report
Please find page 80 of the 1998 IBM annual report below. You can navigate through the pages in the report by either clicking on the pages listed below, or by using the keyword search tool below to find specific information within the annual report.-
 1
1 -
2
-
3
-
4
-
5
-
6
-
7
-
8
-
9
-
10
-
11
-
12
-
13
-
14
-
15
-
16
-
17
-
18
-
19
-
20
-
21
-
22
-
23
-
24
-
25
-
26
-
27
-
28
-
29
-
30
-
31
-
32
-
33
-
34
-
35
-
36
-
37
-
38
-
39
-
40
-
41
-
42
-
43
-
44
-
45
-
46
-
47
-
48
-
49
-
50
-
51
-
52
-
53
-
54
-
55
-
56
-
57
-
58
-
59
-
60
-
61
-
62
-
63
-
64
-
65
-
66
-
67
-
68
-
69
-
 70
70 -
 71
71 -
 72
72 -
 73
73 -
 74
74 -
 75
75 -
 76
76 -
 77
77 -
 78
78 -
 79
79 -
 80
80 -
 81
81 -
 82
82 -
 83
83 -
 84
84 -
 85
85 -
 86
86 -
 87
87 -
 88
88 -
 89
89 -
 90
90 -
91
-
92
-
93
-
94
-
95
-
96
 |
 |

NOTES TO CONSOLIDATED FINANCIAL STATEMENTS International Business Machines Corporation and Subsidiary Companies
78
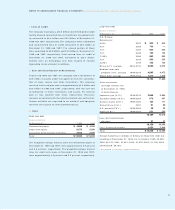
The effect of tax law changes on deferred tax assets and lia-
bilities did not have a significant impact on the company’s
effective tax rate.
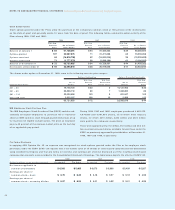
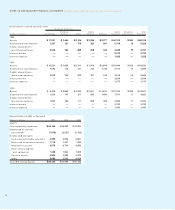
The significant components of activities that gave rise to
deferred tax assets and liabilities included on the balance
sheet were as follows:
DEFERRED TAX ASSETS
(Dollars in millions)
At December 31: 1998 1997
Employee benefits $«««3,909 $«««3,707
Bad debt, inventory and
warranty reserves 1,249 1,027
Alternative minimum tax credits 1,169 1,092
Capitalized research and development 913 1,196
Restructuring charges 863 1,163
Deferred income 686 893
General business credits 555 492
Equity alliances 387 378
Foreign tax loss carryforwards 304 202
State and local tax loss carryforwards 212 203
Depreciation 201 132
Intracompany sales and services 182 235
Other 2,614 2,507
Gross deferred tax assets 13,244 13,227
Less: Valuation allowance 488 2,163
Net deferred tax assets $«12,756 $«11,064
DEFERRED TAX LIABILITIES
(Dollars in millions)
At December 31: 1998 1997
Sales-type leases $«««3,433 $«««3,147
Retirement benefits 2,775 2,147
Depreciation 1,505 1,556
Software costs deferred 287 420
Other 1,841 1,413
Gross deferred tax liabilities $«««9,841 $«««8,683
As part of implementing its global strategies involving the relo-
cation of certain of its manufacturing operations, the company
transferred certain intellectual property rights to several non-
U.S. subsidiaries in December 1998. Since these strategies,
including this transfer, result in the anticipated utilization of
U.S. federal tax credit carryforwards, the company reduced
the valuation allowance from that previously required. The val-
uation allowance at December 31, 1998, principally applies to
certain state and local and foreign tax loss carryforwards that,
in the opinion of management, are more likely than not to
expire before the company can utilize them.
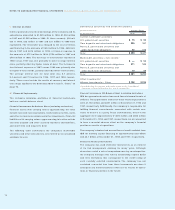
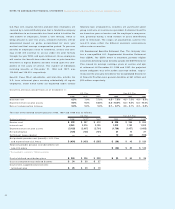
A reconciliation of the company’s effective tax rate to the
statutory U.S. federal tax rate is as follows:
For the year ended December 31: 1998 1997 1996
Statutory rate 35% 35% 35%
Foreign tax differential (6) (3) 2
State and local 111
U.S. valuation allowance
related items (1) — (6)
Other 1—5
Effective rate 30% 33% 37%
For tax return purposes, the company has available tax credit
carryforwards of approximately $2,067 million, of which $1,169
million have an indefinite carryforward period, $184 million
expire in 1999 and the remainder thereafter. The company also
has state and local and foreign tax loss carryforwards, the tax
effect of which is $516 million. Most of these carryforwards are
available for 10 years or have an indefinite carryforward period.
Undistributed earnings of non-U.S. subsidiaries included in
consolidated retained earnings amounted to $13,165 million at
December 31, 1998, $12,511 million at December 31, 1997,
and $12,111 million at December 31, 1996. These earnings,
which reflect full provision for non-U.S. income taxes, are
indefinitely reinvested in non-U.S. operations or will be remit-
ted substantially free of additional tax.
RSelling and Advertising
Selling and advertising expense is charged against income as
incurred. Advertising expense, which includes media, agency
and promotional expenses, amounted to $1,681 million, $1,708
million and $1,569 million in 1998, 1997 and 1996, respectively.
SResearch, Development and Engineering
Research, development and engineering expense amounted
to $5,046 million in 1998, $4,877 million in 1997 and $5,089 mil-
lion in 1996. Expenditures for product-related engineering
included in these amounts were $580 million, $570 million and
$720 million in 1998, 1997 and 1996, respectively.
Expenditures of $4,466 million in 1998, $4,307 million in 1997
and $4,369 million in 1996 were made for research and
development activities covering basic scientific research and
the application of scientific advances to the development of
new and improved products and their uses. Of these amounts,
software-related activities were $2,086 million, $2,016 million
and $2,161 million in 1998, 1997 and 1996, respectively.
Included in the 1996 expenditures is $435 million of purchased
in-process research and development expense relating to the
Tivoli and Object Technology International, Inc. acquisitions.