IBM 1998 Annual Report Download - page 88
Download and view the complete annual report
Please find page 88 of the 1998 IBM annual report below. You can navigate through the pages in the report by either clicking on the pages listed below, or by using the keyword search tool below to find specific information within the annual report.-
 1
1 -
2
-
3
-
4
-
5
-
6
-
7
-
8
-
9
-
10
-
11
-
12
-
13
-
14
-
15
-
16
-
17
-
18
-
19
-
20
-
21
-
22
-
23
-
24
-
25
-
26
-
27
-
28
-
29
-
30
-
31
-
32
-
33
-
34
-
35
-
36
-
37
-
38
-
39
-
40
-
41
-
42
-
43
-
44
-
45
-
46
-
47
-
48
-
49
-
50
-
51
-
52
-
53
-
54
-
55
-
56
-
57
-
58
-
59
-
60
-
61
-
62
-
63
-
64
-
65
-
66
-
67
-
68
-
69
-
70
-
71
-
72
-
73
-
74
-
75
-
76
-
77
-
 78
78 -
 79
79 -
 80
80 -
 81
81 -
 82
82 -
 83
83 -
 84
84 -
 85
85 -
 86
86 -
 87
87 -
 88
88 -
 89
89 -
 90
90 -
 91
91 -
 92
92 -
 93
93 -
 94
94 -
 95
95 -
 96
96
 |
 |

NOTES TO CONSOLIDATED FINANCIAL STATEMENTS International Business Machines Corporation and Subsidiary Companies
86
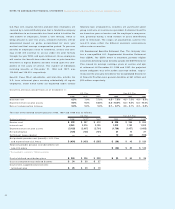
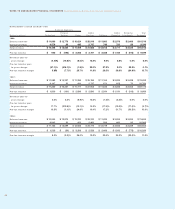
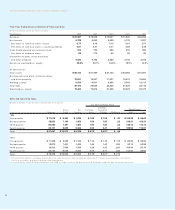
MANAGEMENT SYSTEM SEGMENT VIEW
Hardware Segments
Personal Global Global Enterprise Total
(Dollars in millions) Technology Systems Server Services Software Financing Investments Segments
1998:
External revenue « $«11,890 $«12,776 $«10,624 $«28,916 $«11,863 $«2,979 $«2,468 $«81,516
Internal revenue 4,578 29 445 2,747 749 792 56 9,396
Total revenue $«16,468 $«12,805 $«11,069 $«31,663 $«12,612 $«3,771 $«2,524 $«90,912
Pre-tax income ÷÷«« $««««««955 $÷÷«(992) $«««2,842 $÷«3,757 $«««2,588 $«1,165 $«««(616) $«««9,699
Revenue year-to-
year change (4.4) %% (10.8) % (6.0) % 13.5% 6.6% 5.8% 0.6% 2.0%
Pre-tax income year-
to-year change (47.1) % (516.1) % (1.9) % 30.0% 27.2% 3.0% 32.3% 0.1%
Pre-tax income margin 5.8%% (7.7) % 25.7% 11.9% 20.5% 30.9% (24.4) % 10.7%
1997:
External revenue « $«11,083 $«14,337 $«11,286 $«25,166 $«11,164 $«2,935 $«2,438 $«78,409
Internal revenue 6,147 20 491 2,737 671 628 70 10,764
Total revenue $«17,230 $«14,357 $«11,777 $«27,903 $«11,835 $«3,563 $«2,508 $«89,173
Pre-tax income $«««1,806 $÷÷«(161) $«««2,896 $«««2,890 $«««2,034 $«1,131 $÷«(910) $÷«9,686
Revenue year-to-
year change 0.3% 3.3% (6.9) % 12.6% (1.5) % (3.3) % 5.0% 3.0%
Pre-tax income year-
to-year change 17.7% (312.8) % (12.1) % 14.3% (17.5) % (10.2) % (17.4) % (5.7) %
Pre-tax income margin 10.5% (1.1) % 24.6% 10.4% 17.2% 31.7% (36.3) % 10.9%
1996:
External revenue « $«10,244 $«13,876 $«12,230 $«22,310 $«11,426 $«3,224 $«2,294 $«75,604
Internal revenue 6,942 23 423 2,460 593 462 95 10,998
Total revenue $«17,186 $«13,899 $«12,653 $«24,770 $«12,019 $«3,686 $«2,389 $«86,602
Pre-tax income ÷« $÷«1,535 $÷÷÷«(39) $÷«3,293 $÷«2,529 $÷«2,466 $«1,260 $«««(775) $«10,269
Pre-tax income margin 8.9% (0.3) % 26.0% 10.2% 20.5% 34.2% (32.4) % 11.9%