IBM 1998 Annual Report Download - page 56
Download and view the complete annual report
Please find page 56 of the 1998 IBM annual report below. You can navigate through the pages in the report by either clicking on the pages listed below, or by using the keyword search tool below to find specific information within the annual report.-
 1
1 -
2
-
3
-
4
-
5
-
6
-
7
-
8
-
9
-
10
-
11
-
12
-
13
-
14
-
15
-
16
-
17
-
18
-
19
-
20
-
21
-
22
-
23
-
24
-
25
-
26
-
27
-
28
-
29
-
30
-
31
-
32
-
33
-
34
-
35
-
36
-
37
-
38
-
39
-
40
-
41
-
42
-
43
-
44
-
45
-
 46
46 -
 47
47 -
 48
48 -
 49
49 -
 50
50 -
 51
51 -
 52
52 -
 53
53 -
 54
54 -
 55
55 -
 56
56 -
 57
57 -
 58
58 -
 59
59 -
 60
60 -
 61
61 -
 62
62 -
 63
63 -
 64
64 -
 65
65 -
 66
66 -
67
-
68
-
69
-
70
-
71
-
72
-
73
-
74
-
75
-
76
-
77
-
78
-
79
-
80
-
81
-
82
-
83
-
84
-
85
-
86
-
87
-
88
-
89
-
90
-
91
-
92
-
93
-
94
-
95
-
96
 |
 |

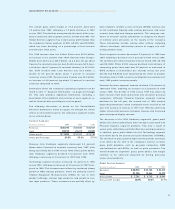
Overview
IBM’s financial results for 1998 demonstrated the value and
strength of the company’s portfolio of businesses. The com-
pany achieved good results despite a number of challenges
throughout the year: weakness in Asia, ongoing softness in
memory chip prices, continued pricing pressures across many
of its product lines, product transitions in the Server segment
and weakness in Latin America during the second half of the
year. Despite all of these factors, the company achieved overall
strong performance, especially from its Global Services seg-
ment, Software segment and hard disk drive (HDD) products
of the Technology segment. The AS/400 product line, when
viewed on a combined software and hardware basis, had
good year-over-year performance. On a geographic basis,
good results within North America and Europe were somewhat
offset by weakness in Asia and Latin America.
The company’s financial results showed improved revenue
growth and a more balanced performance between gross
profit and expense in the second half of the year versus the
first half of 1998. This improved performance led to a diluted
earnings per share growth of about 17 percent in the second
half of the year, versus a decline of about 1 percent in the first
half of the year when compared to the same periods of 1997.
The company reported revenue of $81.7 billion—a record for
the fourth consecutive year; while net income of $6.3 billion
yielded a record $6.57 earnings per share of common stock—
assuming dilution. The company funded investments of
approximately $20 billion in capital expenditures, research
and development, strategic acquisitions and repurchases of
common stock.
Challenges
While good progress was made in 1998, there are a number of
uncertainties facing the company in 1999: the continued weak
economies in Asia and Latin America, continued price pres-
sure in the information technology industry, particularly within
the fiercely competitive Personal Systems segment and the
microelectronics unit of the Technology segment, and how
the “Year 2000 issue” will affect customer purchases. The
company’s focus in 1999 will be to increase revenue with par-
ticular emphasis on addressing customers’ needs to build
integrated e-business solutions through the use of the com-
pany’s hardware, services, software and technology. In addi-
tion, the company plans to continue to invest judiciously,
reduce infrastructure and optimize the deployment of the
company’s employees and resources to maintain or improve
its pre-tax profits.
MANAGEMENT DISCUSSION International Business Machines Corporation and Subsidiary Companies
54
Forward-looking and Cautionary Statements
Certain statements contained in this Annual Report may con-
stitute forward-looking statements within the meaning of the
Private Securities Litigation Reform Act of 1995. These state-
ments involve a number of risks, uncertainties and other
factors that could cause actual results to differ materially, as
discussed more fully elsewhere in this Annual Report and in
the company’s filings with the Securities and Exchange
Commission, including the company’s 1998 Form 10-K to be
filed on or about March 26, 1999.
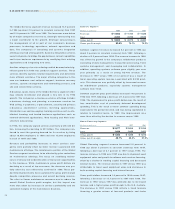
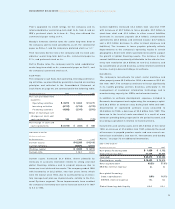
Results of Operations
(Dollars in millions except per share amounts)
1998 1997 1996
Revenue $«81,667 $«78,508 $«75,947
Cost 50,795 47,899 45,408
Gross profit 30,872 30,609 30,539
Gross profit margin 37.8% 39.0% 40.2%
Total expense 21,832 21,582 21,952
Income before
income taxes $«««9,040 $÷«9,027 $«««8,587
Net income $«««6,328 $«÷6,093 $«««5,429
Earnings per share of
common stock—basic $«««««6.75 $÷÷«6.18 $«««««5.12
Earnings per share of
common stock—
assuming dilution $«««««6.57 $÷÷«6.01 $÷÷«5.01
Revenue in 1998 grew 4.0 percent as reported and 6.2 percent
when currency impacts are removed. This increase was pri-
marily driven by growth in the Global Services segment, HDD
storage products of the Technology segment, and middleware
software offerings including those from Tivoli Systems, Inc.
(Tivoli) of the Software segment.
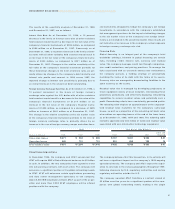
The following table provides the company’s percentage of
revenue by segment and illustrates the continuing shift toward
a greater percentage of the company’s revenue being derived
from the Global Services and Software segments.
1998 1997 1996
Hardware segments 43.4% 46.7% 48.2%
Global Services segment 35.4 32.1 29.4
Software segment 14.5 14.2 15.0
Global Financing segment 3.5 3.6 4.0
Enterprise Investments
segment/Other 3.2 3.4 3.4
Total 100.0% 100.0% 100.0%