IBM 1998 Annual Report Download - page 82
Download and view the complete annual report
Please find page 82 of the 1998 IBM annual report below. You can navigate through the pages in the report by either clicking on the pages listed below, or by using the keyword search tool below to find specific information within the annual report.-
 1
1 -
2
-
3
-
4
-
5
-
6
-
7
-
8
-
9
-
10
-
11
-
12
-
13
-
14
-
15
-
16
-
17
-
18
-
19
-
20
-
21
-
22
-
23
-
24
-
25
-
26
-
27
-
28
-
29
-
30
-
31
-
32
-
33
-
34
-
35
-
36
-
37
-
38
-
39
-
40
-
41
-
42
-
43
-
44
-
45
-
46
-
47
-
48
-
49
-
50
-
51
-
52
-
53
-
54
-
55
-
56
-
57
-
58
-
59
-
60
-
61
-
62
-
63
-
64
-
65
-
66
-
67
-
68
-
69
-
70
-
71
-
 72
72 -
 73
73 -
 74
74 -
 75
75 -
 76
76 -
 77
77 -
 78
78 -
 79
79 -
 80
80 -
 81
81 -
 82
82 -
 83
83 -
 84
84 -
 85
85 -
 86
86 -
 87
87 -
 88
88 -
 89
89 -
 90
90 -
 91
91 -
 92
92 -
93
-
94
-
95
-
96
 |
 |

NOTES TO CONSOLIDATED FINANCIAL STATEMENTS International Business Machines Corporation and Subsidiary Companies
80
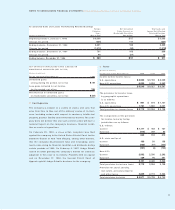
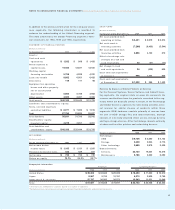
IBM Employees Stock Purchase Plan
The IBM Employees Stock Purchase Plan (ESPP) enables sub-
stantially all regular employees to purchase full or fractional
shares of IBM common stock through payroll deductions of up
to 10 percent of eligible compensation. The price an employee
pays is 85 percent of the average market price on the last day
of an applicable pay period.
During 1998, 1997 and 1996, employees purchased 3,993,372,
4,676,980 and 6,461,856 shares, all of which were treasury
shares, for which $415 million, $354 million and $324 million
were paid to the company, respectively.
There were approximately 31.5 million, 35.5 million and 40.2 mil-
lion reserved unissued shares available for purchase under the
ESPP, as previously approved by stockholders, at December 31,
1998, 1997 and 1996, respectively.
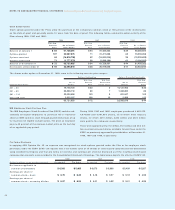
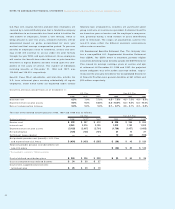
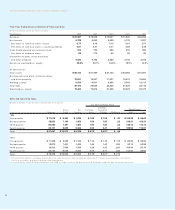
Stock Option Grants
Stock options granted under the Plans allow the purchase of the company’s common stock at 100 percent of the market price
on the date of grant and generally expire 10 years from the date of grant. The following tables summarize option activity of the
Plans during 1998, 1997 and 1996:
1998 1997 1996
Wtd. Avg. Wtd. Avg. Wtd. Avg.
Exercise No. of Shares Exercise No. of Shares Exercise No. of Shares
Price under Option Price under Option Price under Option
Balance at January 1 $««54 61,728,361 $«44 61,435,322 $«39 68,565,806
Options granted 107 20,587,675 71 21,471,228 63 15,359,058
Options exercised 44 (14,816,738) 42 (19,630,005) 36 (19,302,622)
Options terminated 71 (1,777,373) 56 (1,548,184) 61 (3,186,920)
Balance at December 31 $««72 65,721,925 $«54 61,728,361 $«44 61,435,322
Exercisable at December 31 $««44 23,095,818 $«38 26,619,548 $«41 30,603,845
The shares under option at December 31, 1998, were in the following exercise price ranges:
Options Outstanding Options Currently Exercisable
Wtd. Avg. Wtd. Avg. Wtd. Avg.
No. of Exercise Contractual No. of Exercise
Exercise Price Range Options Price Life (in years) Options Price
$21 – 50 16,708,124 $«32 5 15,137,952 $«32
$51 – 80 26,369,118 68 7 7,463,820 66
$81 – 110 20,024,496 103 9 491,047 103
$111 and over 2,620,187 138 10 2,999 112
65,721,925 $«72 23,095,818 $«44
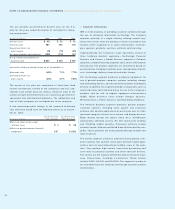
Pro Forma Disclosure
In applying APB Opinion No. 25, no expense was recognized for stock options granted under the Plan or for employee stock
purchases under the ESPP. SFAS 123 requires that a fair market value of all awards of stock-based compensation be determined
using standard techniques and that pro forma net income and earnings per share be disclosed as if the resulting stock-based
compensation amounts were recorded in the Consolidated Statement of Earnings. The table below depicts the effects of SFAS 123.
1998 1997 1996
(Dollars in millions except per share amounts) As reported Pro forma As reported Pro forma As reported Pro forma
Net income applicable to
common shareholders $«6,308 $«5,985 $«6,073 $«5,866 $«5,409 $«5,267
Earnings per share of
common stock—basic $«««6.75 $«««6.40 $«««6.18 $«««5.97 $«««5.12 $«««4.98
Earnings per share of
common stock—assuming dilution $÷«6.57 $«««6.24 $«««6.01 $«««5.82 $«««5.01 $«««4.89