Honda 2008 Annual Report Download - page 97
Download and view the complete annual report
Please find page 97 of the 2008 Honda annual report below. You can navigate through the pages in the report by either clicking on the pages listed below, or by using the keyword search tool below to find specific information within the annual report.-
 1
1 -
2
-
3
-
4
-
5
-
6
-
7
-
8
-
9
-
10
-
11
-
12
-
13
-
14
-
15
-
16
-
17
-
18
-
19
-
20
-
21
-
22
-
23
-
24
-
25
-
26
-
27
-
28
-
29
-
30
-
31
-
32
-
33
-
34
-
35
-
36
-
37
-
38
-
39
-
40
-
41
-
42
-
43
-
44
-
45
-
46
-
47
-
48
-
49
-
50
-
51
-
52
-
53
-
54
-
55
-
56
-
57
-
58
-
59
-
60
-
61
-
62
-
63
-
64
-
65
-
66
-
67
-
68
-
69
-
70
-
71
-
72
-
73
-
74
-
75
-
76
-
77
-
78
-
79
-
80
-
81
-
82
-
83
-
84
-
85
-
86
-
 87
87 -
 88
88 -
 89
89 -
 90
90 -
 91
91 -
 92
92 -
 93
93 -
 94
94 -
 95
95 -
 96
96 -
 97
97 -
 98
98 -
 99
99 -
 100
100 -
 101
101 -
 102
102 -
 103
103 -
 104
104 -
 105
105 -
 106
106 -
 107
107 -
108
-
109
-
110
-
111
-
112
-
113
-
114
-
115
-
116
-
117
-
118
-
119
-
120
-
121
-
122
-
123
-
124
-
125
-
126
-
127
-
128
 |
 |

A n n u a l R e p o r t 2 0 0 8 9 5
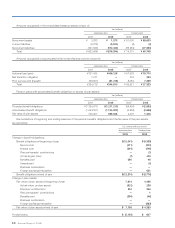
U.S. dollars
(millions) (note 2)
Before-tax
amount
Tax (expense)
or benefit
(note 11)
Net-of-tax
amount
2008:
Adjustments from foreign currency translation $(3,693) $576 $(3,117)
Unrealized gains (losses) on marketable securities:
Unrealized holding gains (losses) arising during the year (431) 168 (263)
Reclassification adjustments for losses (gains) realized in net income (1) 0 (1)
Net unrealized gains (losses) (432) 168 (264)
Unrealized gains (losses) on derivative instruments
Unrealized holding gains (losses) arising during the year 7 (3) 4
Reclassification adjustments for losses (gains) realized in net income 0 (0) 0
Net unrealized gains (losses) 7 (3) 4
Pension and other postretirement benefits adjustment*
Unrealized gains (losses) arising during the year (454) 200 (254)
Reclassification adjustments for losses (gains) realized in net income 135 (48) 87
Net unrealized gains (losses) (319) 152 (167)
Other comprehensive income (loss) $(4,437) $893 $(3,544)
* The primary component of other comprehensive income (loss) for Pension and other postretirement benefits adjustment is actuarial gains or losses.
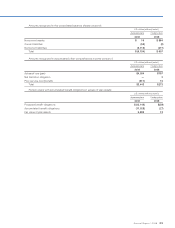
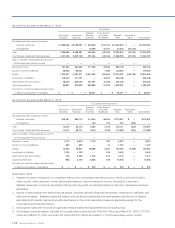
16. Fair Value of Financial Instruments
The estimated fair values of significant financial instruments at March 31, 2007 and 2008 are as follows (see note 1 (q)):
Yen
(millions)
U.S. dollars
(millions)
(note 2)
2007 2008 2008
Carrying
amount
Estimated
fair value
Carrying
amount
Estimated
fair value
Carrying
amount
Estimated
fair value
Finance subsidiaries—receivables (a) ¥ 3,434,721 ¥ 3,444,144 ¥ 3,590,110 ¥ 3,661,502 $ 35,833 $ 36,546
Marketable securities 210,598 210,598 120,085 120,085 1,199 1,199
Held-to-maturity securities 16,337 16,348 20,672 20,851 206 208
Debt (3,947,020) (3,960,743) (4,394,817) (4,428,164) (43,865) (44,198)
Foreign exchange instruments (b)
Asset position 3,735 3,735 116,169 116,169 1,160 1,160
Liability position (24,783) (24,783) 429 429 4 4
Net (21,048) (21,048) 116,598 116,598 1,164 1,164
Interest rate instruments (c)
Asset position 10,866 10,866 (19,662) (19,662) (196) (196)
Liability position (2,417) (2,417) (54,721) (54,721) (546) (546)
Net 8,449 8,449 (74,383) (74,383) (742) (742)
(a) The carrying amounts of finance subsidiaries—receivables at March 31, 2007 and 2008 in the table exclude ¥1,709,978
million and ¥1,111,187 million ($11,091 million) of direct financing leases, net, classified as finance subsidiaries—receivables
in the consolidated balance sheets, respectively. The carrying amounts of finance subsidiaries—receivables at March
31, 2007 and 2008 in the table also include ¥678,649 million and ¥652,749 million ($6,515 million) of finance receivables
classified as trade receivables and other assets in the consolidated balance sheets, respectively.