Honda 2008 Annual Report Download - page 104
Download and view the complete annual report
Please find page 104 of the 2008 Honda annual report below. You can navigate through the pages in the report by either clicking on the pages listed below, or by using the keyword search tool below to find specific information within the annual report.-
 1
1 -
2
-
3
-
4
-
5
-
6
-
7
-
8
-
9
-
10
-
11
-
12
-
13
-
14
-
15
-
16
-
17
-
18
-
19
-
20
-
21
-
22
-
23
-
24
-
25
-
26
-
27
-
28
-
29
-
30
-
31
-
32
-
33
-
34
-
35
-
36
-
37
-
38
-
39
-
40
-
41
-
42
-
43
-
44
-
45
-
46
-
47
-
48
-
49
-
50
-
51
-
52
-
53
-
54
-
55
-
56
-
57
-
58
-
59
-
60
-
61
-
62
-
63
-
64
-
65
-
66
-
67
-
68
-
69
-
70
-
71
-
72
-
73
-
74
-
75
-
76
-
77
-
78
-
79
-
80
-
81
-
82
-
83
-
84
-
85
-
86
-
87
-
88
-
89
-
90
-
91
-
92
-
93
-
 94
94 -
 95
95 -
 96
96 -
 97
97 -
 98
98 -
 99
99 -
 100
100 -
 101
101 -
 102
102 -
 103
103 -
 104
104 -
 105
105 -
 106
106 -
 107
107 -
 108
108 -
 109
109 -
 110
110 -
 111
111 -
 112
112 -
 113
113 -
 114
114 -
115
-
116
-
117
-
118
-
119
-
120
-
121
-
122
-
123
-
124
-
125
-
126
-
127
-
128
 |
 |

A n n u a l R e p o r t 2 0 0 8
102
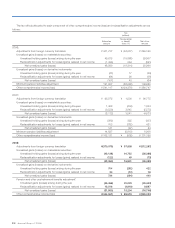
As of and for the year ended March 31, 2008
Yen (millions)
Motorcycle
Business
Automobile
Business
Financial
Services
Business
Power Product
and Other
Businesses
Segment
Total
Reconciling
Items Consolidated
Net sales and other operating revenue:
External customers ¥ 1,558,696 ¥ 9,489,391 ¥ 533,553 ¥ 421,194 ¥12,002,834 ¥ — ¥12,002,834
Intersegment — — 15,499 21,571 37,070 (37,070) —
Total 1,558,696 9,489,391 549,052 442,765 12,039,904 (37,070) 12,002,834
Cost of sales, SG&A and R&D expenses 1,407,409 8,827,726 431,254 420,406 11,086,795 (37,070) 11,049,725
Gain on transfer of the substitutional portion
of the Employee’s Pension Funds — — — — — — —
Segment income 151,287 661,665 117,798 22,359 953,109 — 953,109
Equity in income of affiliates 28,035 89,521 — 1,386 118,942 — 118,942
Assets 1,240,527 5,591,311 5,907,839 330,604 13,070,281 (454,738) 12,615,543
Investments in affiliates 118,219 411,001 — 16,976 546,196 — 546,196
Depreciation and amortization 48,000 356,003 101,987 12,435 518,425 — 518,425
Capital expenditures 86,687 544,922 839,888 21,794 1,493,291 — 1,493,291
Provision for credit and lease residual losses
on finance subsidiaries—receivables ¥ — ¥ — ¥ 58,011 ¥ — ¥ 58,011 ¥ — ¥ 58,011
As of and for the year ended March 31, 2008
U.S. dollars (millions) (note 2)
Motorcycle
Business
Automobile
Business
Financial
Services
Business
Power Product
and Other
Businesses
Segment
Total
Reconciling
Items Consolidated
Net sales and other operating revenue:
External customers $15,557 $94,715 $ 5,325 $4,204 $119,801 $ — $119,801
Intersegment — — 155 215 370 (370) —
Total 15,557 94,715 5,480 4,419 120,171 (370) 119,801
Cost of sales, SG&A and R&D expenses 14,047 88,111 4,304 4,196 110,658 (370) 110,288
Gain on transfer of the substitutional portion
of the Employee’s Pension Funds — — — — — — —
Segment income 1,510 6,604 1,176 223 9,513 — 9,513
Equity in income of affiliates 280 893 — 14 1,187 — 1,187
Assets 12,382 55,807 58,966 3,300 130,455 (4,539) 125,916
Investments in affiliates 1,180 4,103 — 169 5,452 — 5,452
Depreciation and amortization 479 3,553 1,018 124 5,174 — 5,174
Capital expenditures 865 5,439 8,383 218 14,905 — 14,905
Provision for credit and lease residual losses
on finance subsidiaries—receivables $ — $ — $ 579 $ — $ 579 $ — $ 579
Explanatory notes:
1. Segment income is measured in a consistent manner with consolidated operating income, which is net income before
other income, other expenses, income tax (benefit) expense, minority interest in income, and equity in income of
affiliates. Expenses not directly associated with specific segments are allocated based on the most reasonable measures
applicable.
2. Assets of each segment are defined as total assets, including derivative financial instruments, investments in affiliates, and
deferred tax assets. Segment assets are based on those directly associated with each segment and those not directly
associated with specific segments are allocated based on the most reasonable measures applicable except for the
corporate assets described below.
3. Intersegment sales and revenues are generally made at values that approximate arm’s-length prices.
4. Unallocated corporate assets, included in reconciling items, amounted to ¥354,903 million as of March 31, 2006, ¥377,873
million as of March 31, 2007, and ¥385,442 million ($3,847 million) as of March 31, 2008 respectively, which consist