Honda 2008 Annual Report Download - page 105
Download and view the complete annual report
Please find page 105 of the 2008 Honda annual report below. You can navigate through the pages in the report by either clicking on the pages listed below, or by using the keyword search tool below to find specific information within the annual report.-
 1
1 -
2
-
3
-
4
-
5
-
6
-
7
-
8
-
9
-
10
-
11
-
12
-
13
-
14
-
15
-
16
-
17
-
18
-
19
-
20
-
21
-
22
-
23
-
24
-
25
-
26
-
27
-
28
-
29
-
30
-
31
-
32
-
33
-
34
-
35
-
36
-
37
-
38
-
39
-
40
-
41
-
42
-
43
-
44
-
45
-
46
-
47
-
48
-
49
-
50
-
51
-
52
-
53
-
54
-
55
-
56
-
57
-
58
-
59
-
60
-
61
-
62
-
63
-
64
-
65
-
66
-
67
-
68
-
69
-
70
-
71
-
72
-
73
-
74
-
75
-
76
-
77
-
78
-
79
-
80
-
81
-
82
-
83
-
84
-
85
-
86
-
87
-
88
-
89
-
90
-
91
-
92
-
93
-
94
-
 95
95 -
 96
96 -
 97
97 -
 98
98 -
 99
99 -
 100
100 -
 101
101 -
 102
102 -
 103
103 -
 104
104 -
 105
105 -
 106
106 -
 107
107 -
 108
108 -
 109
109 -
 110
110 -
 111
111 -
 112
112 -
 113
113 -
 114
114 -
 115
115 -
116
-
117
-
118
-
119
-
120
-
121
-
122
-
123
-
124
-
125
-
126
-
127
-
128
 |
 |
A n n u a l R e p o r t 2 0 0 8 103
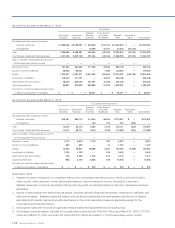
primarily of cash and cash equivalents and marketable securities held by the Company. Reconciling items also include
elimination of intersegment transactions.
5. Depreciation and amortization of the Financial Services Business include ¥9,741 million for the year ended March 31,
2007 and ¥101,032 million ($1,008 million) for the year ended March 31, 2008 respectively, of depreciation of property on
operating leases.
6. Capital expenditures of the Financial Services Business includes ¥366,795 million for the year ended March 31, 2007 and
¥839,261 million ($8,377 million) for the year ended March 31, 2008 respectively, of purchase of operating lease assets.
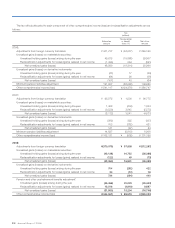
External Sales and Other Operating Revenue by Product or Service Groups
Yen
(millions)
U.S. dollars
(millions)
(note 2)
Years ended March 31: 2006 2007 2008 2008
Motorcycles and relevant parts ¥1,051,855 ¥ 1,221,638 ¥ 1,418,028 $ 14,153
All-terrain vehicles (ATVs), personal watercraft and relevant parts 173,957 148,979 140,668 1,404
Automobiles and relevant parts 8,004,694 8,889,080 9,489,391 94,715
Financial, insurance services 306,869 409,701 533,553 5,325
Power products and relevant parts 263,651 287,302 288,243 2,877
Others 106,970 130,440 132,951 1,327
Total ¥ 9,907,996 ¥11,087,140 ¥12,002,834 $119,801
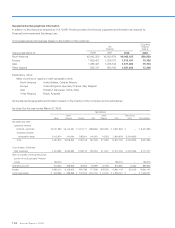
Geographical Information
As of and for the year ended March 31, 2006
Yen (millions)
Japan United States Other Countries Total
Sales to external customers ¥2,021,999 ¥4,876,436 ¥3,009,561 ¥9,907,996
Long-lived assets 949,358 499,599 477,764 1,926,721
As of and for the year ended March 31, 2007
Yen (millions)
Japan United States Other Countries Total
Sales to external customers ¥2,061,720 ¥5,291,683 ¥3,733,737 ¥11,087,140
Long-lived assets 992,723 929,107 610,100 2,531,930
As of and for the year ended March 31, 2008
Yen (millions)
Japan United States Other Countries Total
Sales to external customers ¥2,053,401 ¥5,313,858 ¥4,635,575 ¥12,002,834
Long-lived assets 1,084,163 1,479,137 669,546 3,232,846
As of and for the year ended March 31, 2008
U.S. dollars (millions) (note 2)
Japan United States Other Countries Total
Sales to external customers $20,495 $53,038 $46,268 $119,801
Long-lived assets 10,821 14,763 6,683 32,267
The above information is based on the location of the Company and its subsidiaries.