Honda 2008 Annual Report Download - page 7
Download and view the complete annual report
Please find page 7 of the 2008 Honda annual report below. You can navigate through the pages in the report by either clicking on the pages listed below, or by using the keyword search tool below to find specific information within the annual report.-
 1
1 -
 2
2 -
 3
3 -
 4
4 -
 5
5 -
 6
6 -
 7
7 -
 8
8 -
 9
9 -
 10
10 -
 11
11 -
 12
12 -
 13
13 -
 14
14 -
 15
15 -
 16
16 -
 17
17 -
 18
18 -
19
-
20
-
21
-
22
-
23
-
24
-
25
-
26
-
27
-
28
-
29
-
30
-
31
-
32
-
33
-
34
-
35
-
36
-
37
-
38
-
39
-
40
-
41
-
42
-
43
-
44
-
45
-
46
-
47
-
48
-
49
-
50
-
51
-
52
-
53
-
54
-
55
-
56
-
57
-
58
-
59
-
60
-
61
-
62
-
63
-
64
-
65
-
66
-
67
-
68
-
69
-
70
-
71
-
72
-
73
-
74
-
75
-
76
-
77
-
78
-
79
-
80
-
81
-
82
-
83
-
84
-
85
-
86
-
87
-
88
-
89
-
90
-
91
-
92
-
93
-
94
-
95
-
96
-
97
-
98
-
99
-
100
-
101
-
102
-
103
-
104
-
105
-
106
-
107
-
108
-
109
-
110
-
111
-
112
-
113
-
114
-
115
-
116
-
117
-
118
-
119
-
120
-
121
-
122
-
123
-
124
-
125
-
126
-
127
-
128
 |
 |

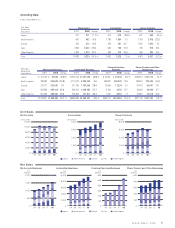
Operating Data
Y e ars e ndedMarc h3 1
Unit Sales
Motorcycles
Automobile Business Financial Services Business
Power Product and Other Businesses
Net Sales
Motorcycle Business
Y en
ns
Y en
ns
Y en
ns
Y en
ns
Y en
ns Y en
Y en
ns
Y en
ns
Y en
ns
Y en
ns
Y en
ns
12,000
10,000
8,000
6,000
4,000
2,000
0
hs a nds hs a nds hs a nds
2,000
1,500
1,000
500
0
04 05 06 07 08 04 05 06 07 08 04 05 06 07 08
04 05 06 07 08 04 05 06 07 08 04 05 06 07 08 04 05 06 07 08
10,000
8,000
6,000
4,000
2,000
0
600
500
400
300
200
100
0
500
400
300
200
100
0
4,000
3,000
2,000
1,000
0
8,000
6,000
4,000
2,000
0
Automobiles Power Products
Japan North America Europe Asia Other Regions
Japan North America Europe Asia Other Regions
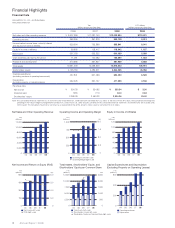
Unit Sales
Breakdown
(Thousands)
Motorcycles Automobiles Power Products
2007 2008 Change 2007 2008 Change 2007 2008 Change
Japan 337 311 (7.7)%672 615 (8.5)%527 550 4.4 %
North America 503 453 (9.9) 1,788 1,850 3.5 3,103 2,415 (22.2)
Europe 329 313 (4.9) 324 391 20.7 1,625 1,693 4.2
Asia 7,895 6,633 (16.0) 620 755 21.8 760 915 20.4
Other Regions 1,305 1,610 23.4 248 314 26.6 406 484 19.2
Total 10,369 9,320 (10.1)%3,652 3,925 7.5 %6,421 6,057 (5.7)%
Net Sales
Breakdown
Yen (millions)
Motorcycle Business Automobile Business
Financial Services
Business
Power Product and Other
Businesses
2007 2008 Change 2007 2008 Change 2007 2008 Change 2007 2008 Change
Japan ¥ 101,753 ¥ 93,592 (8.0)%¥1,412,726 ¥1,321,005 (6.5)%¥ 21,497 ¥ 23,405 8.9 %¥145,214 ¥147,775 1.8 %
North America 308,293 265,609 (13.8) 5,179,139 5,209,446 0.6 364,892 483,925 32.6 128,552 109,445 (14.9)
Europe 219,773 226,687 3.1 917,199 1,182,666 28.9 12,642 13,234 4.7 87,143 96,847 11.1
Asia 383,389 484,418 26.4 861,612 1,048,463 21.7 3,150 4,936 56.7 35,003 39,449 12.7
Other Regions 357,409 488,390 36.6 518,404 727,811 40.4 7,520 8,053 7.1 21,830 27,678 26.8
Total ¥1,370,617 ¥1,558,696 13.7 %¥8,889,080 ¥9,489,391 6.8 %¥409,701 ¥533,553 30.2 %¥417,742 ¥421,194 0.8 %
Annual Report 2008 5