Honda 2008 Annual Report Download - page 80
Download and view the complete annual report
Please find page 80 of the 2008 Honda annual report below. You can navigate through the pages in the report by either clicking on the pages listed below, or by using the keyword search tool below to find specific information within the annual report.-
 1
1 -
2
-
3
-
4
-
5
-
6
-
7
-
8
-
9
-
10
-
11
-
12
-
13
-
14
-
15
-
16
-
17
-
18
-
19
-
20
-
21
-
22
-
23
-
24
-
25
-
26
-
27
-
28
-
29
-
30
-
31
-
32
-
33
-
34
-
35
-
36
-
37
-
38
-
39
-
40
-
41
-
42
-
43
-
44
-
45
-
46
-
47
-
48
-
49
-
50
-
51
-
52
-
53
-
54
-
55
-
56
-
57
-
58
-
59
-
60
-
61
-
62
-
63
-
64
-
65
-
66
-
67
-
68
-
69
-
 70
70 -
 71
71 -
 72
72 -
 73
73 -
 74
74 -
 75
75 -
 76
76 -
 77
77 -
 78
78 -
 79
79 -
 80
80 -
 81
81 -
 82
82 -
 83
83 -
 84
84 -
 85
85 -
 86
86 -
 87
87 -
 88
88 -
 89
89 -
 90
90 -
91
-
92
-
93
-
94
-
95
-
96
-
97
-
98
-
99
-
100
-
101
-
102
-
103
-
104
-
105
-
106
-
107
-
108
-
109
-
110
-
111
-
112
-
113
-
114
-
115
-
116
-
117
-
118
-
119
-
120
-
121
-
122
-
123
-
124
-
125
-
126
-
127
-
128
 |
 |

A n n u a l R e p o r t 2 0 0 8
7 8
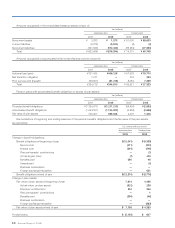
7. Investments and Advances—Other
Investments and advances at March 31, 2007 and 2008 consisted of the following:
Yen
(millions)
U.S. dollars
(millions)
(note 2)
2007 2008 2008
Current
Auction rate securities ¥41,318 ¥ — $ —
Corporate debt securities 311 641 6
U.S. government and agency debt securities 2,993 — —
Advances 581 1,913 19
¥45,203 ¥2,554 $25
Investments and advances due within one year are included in other current assets.
Yen
(millions)
U.S. dollars
(millions)
(note 2)
2007 2008 2008
Noncurrent
Auction rate securities (non-marketable) ¥ — ¥ 13,661 $ 136
Marketable equity securities 169,280 120,085 1,199
Government bonds 2,999 2,999 30
U.S. government and agency debt securities 10,034 17,032 170
Non-marketable equity securities accounted for under the cost method
Non-marketable preferred stocks 2,000 2,000 20
Other 11,639 13,725 137
Guaranty deposits 30,847 29,446 294
Advances 2,481 1,896 19
Other 25,330 21,266 212
¥254,610 ¥222,110 $2,217
Certain information with respect to marketable securities at March 31, 2007 and 2008 is summarized below:
Yen
(millions)
U.S. dollars
(millions)
(note 2)
2007 2008 2008
Available-for-sale
Cost ¥107,573 ¥ 61,104 $ 610
Fair value 210,598 120,085 1,199
Gross unrealized gains 103,113 64,084 640
Gross unrealized losses 88 5,103 51
Held-to-maturity
Amortized cost ¥ 16,337 ¥ 20,672 $ 206
Fair value 16,348 20,851 208
Gross unrealized gains 26 179 2
Gross unrealized losses 15 — —