Honda 2008 Annual Report Download - page 52
Download and view the complete annual report
Please find page 52 of the 2008 Honda annual report below. You can navigate through the pages in the report by either clicking on the pages listed below, or by using the keyword search tool below to find specific information within the annual report.-
 1
1 -
2
-
3
-
4
-
5
-
6
-
7
-
8
-
9
-
10
-
11
-
12
-
13
-
14
-
15
-
16
-
17
-
18
-
19
-
20
-
21
-
22
-
23
-
24
-
25
-
26
-
27
-
28
-
29
-
30
-
31
-
32
-
33
-
34
-
35
-
36
-
37
-
38
-
39
-
40
-
41
-
 42
42 -
 43
43 -
 44
44 -
 45
45 -
 46
46 -
 47
47 -
 48
48 -
 49
49 -
 50
50 -
 51
51 -
 52
52 -
 53
53 -
 54
54 -
 55
55 -
 56
56 -
 57
57 -
 58
58 -
 59
59 -
 60
60 -
 61
61 -
 62
62 -
63
-
64
-
65
-
66
-
67
-
68
-
69
-
70
-
71
-
72
-
73
-
74
-
75
-
76
-
77
-
78
-
79
-
80
-
81
-
82
-
83
-
84
-
85
-
86
-
87
-
88
-
89
-
90
-
91
-
92
-
93
-
94
-
95
-
96
-
97
-
98
-
99
-
100
-
101
-
102
-
103
-
104
-
105
-
106
-
107
-
108
-
109
-
110
-
111
-
112
-
113
-
114
-
115
-
116
-
117
-
118
-
119
-
120
-
121
-
122
-
123
-
124
-
125
-
126
-
127
-
128
 |
 |

A n n u a l R e p o r t 2 0 0 8
5 0
mainly to decreased unit sales in North America. Revenue
from external customers increased ¥3.4 billion, or 0.8%, to
¥421.1 billion, from the previous fiscal year, due mainly to
the positive impact of foreign currency translation effects.
Honda estimates that if the exchange rate of the Japanese
yen had remained unchanged from the previous fiscal year,
consolidated net sales for the period would have decreased
by approximately ¥3.3 billion, or 0.8%, compared to the
increase as reported of ¥3.4 billion, which includes a positive
foreign currency effect.
Operating income was ¥22.3 billion, a decrease of ¥13.8
billion, or 38.2% from the previous fiscal year, due mainly to
the negative impact of the increased SG&A expenses and an
increase of R&D expenses in other businesses, which offset
the positive impact of the foreign currency effects caused by
the appreciation of the European currencies.
Financial Services Business
To support the sale of its products, Honda provides
wholesale financing to dealers and retail lending and leasing
to customers through our finance subsidiaries in Japan, the
United States, Canada, the United Kingdom, Germany, Brazil
and Thailand.
As a result of increased sales of automobiles mainly
in North America, credit assets and property on operating
leases of financial subsidiaries rose 3.4% from the previous
fiscal year, to ¥4,967.5 billion.
In fiscal year 2008, revenue from external customers in a
financial services business increased ¥123.8 billion, or 30.2%,
to ¥533.5 billion from the previous fiscal year due mainly to
an increase in operating lease revenue. Honda estimates
that if the exchange rate of the Japanese yen had remained
unchanged from the previous fiscal year, consolidated net
sales for the period would have increased by approximately
¥137.0 billion, or 33.4%, compared to the increase as reported
of ¥123.8 billion, which includes a negative foreign currency
effect.
Operating income also expanded ¥2.2 billion, or 2.0%,
to ¥117.7 billion from the previous fiscal year, due mainly to
the increased profit attributable to higher revenue benefiting
from a higher loan balance in North America, which offset the
negative impact of the increased SG&A expenses caused by
an increase of provisions for credit losses.
Our finance subsidiaries in North America have historically
accounted for all leases as direct financing leases. However,
starting in the year ended March 31, 2007, some of the leases
which do not qualify for direct financing leases accounting
treatment are accounted for as operating leases. Generally,
direct financing lease revenues and interest income consist
of the recognition of finance lease revenue at inception of
the lease arrangement and subsequent recognition of the
interest income component of total lease payments using
the effective interest method. In comparison, operating lease
revenues include the recognition of the gross lease payment
amounts on a straight line basis over the term of the lease
arrangement, and operating lease vehicles are depreciated
to their estimated residual value on a straight line basis over
the term of the lease. It is not anticipated that the differences
in accounting for operating leases and direct financing leases
will have a material net impact on the Company’s results of
operations overall, however, operating lease revenues and
associated depreciation of leased assets do result in differing
presentation and timing compared to those of direct financing
leases.
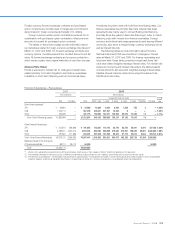
Geographical Information
Japan
In Japan, revenue from domestic and export sales was
¥4,889.0 billion, up ¥114.9 billion, or 2.4% compared to
the previous fiscal year, due primarily to the increased
revenue from exports in automobile business which offset
the negative impact of the decreased revenue in domestic
automobile business. Operating income was ¥192.5 billion,
down ¥35.5 billion, or 15.6%, compared to the previous
fiscal year, due primarily to the increased R&D expenses,
increased depreciation expenses, and substantially increased
raw material costs, which offset the positive impact of the
continuing cost reduction effects, increased profit attributable
to higher revenue, and the decreased SG&A expenses.
North America
In North America, which mainly consists of the United
States, revenue increased ¥92.6 billion, or 1.5%, to ¥6,265.2
billion, due mainly to increased revenue in the automobile
business, which offset the negative impact of foreign currency
translation effects.
Operating income decreased ¥24.1 billion, or 5.3%, to
¥432.6 billion, from the previous fiscal year, due primarily
to the negative impacts of increased sales incentives in the
automobile business, substantially increased raw material
costs, the change in the model mix in the automobile
business, increased SG&A expenses caused by an increase
of provisions for credit losses in the financial services
business, increased depreciation expenses, and the negative
impact of foreign currency effect because of the depreciation
of U.S. dollars, which offset the positive impacts of increased
profit attributable to higher revenue, continuing cost reduction
effects, and increased prices.
Europe
In Europe, revenue increased ¥246.4 billion, or 18.3%, to
¥1,594.2 billion, compared to the previous fiscal year, due
primarily to increased revenue in the automobile business and
the positive impact of foreign currency translation effects.
Operating income increased ¥19.5 billion, or 61.1%, to
¥51.5 billion, from the previous fiscal year, due mainly to the
positive impacts of increased profit attributable to higher
revenue, continuing cost reduction effects and the foreign
currency effects, which offset the negative impacts of the
increased SG&A expenses.
Asia
In Asia, revenue increased ¥366.8 billion, or 28.9%, to
¥1,638.2 billion from the previous fiscal year, due primarily
to increased revenue in the motorcycle and automobile
businesses and the positive impact of foreign currency
translation effects.
Operating income increased ¥53.5 billion, or 69.4%, to
¥130.7 billion, from the previous fiscal year, due mainly to
the positive impacts of increased profit attributable to higher