Honda 2008 Annual Report Download - page 115
Download and view the complete annual report
Please find page 115 of the 2008 Honda annual report below. You can navigate through the pages in the report by either clicking on the pages listed below, or by using the keyword search tool below to find specific information within the annual report.-
 1
1 -
2
-
3
-
4
-
5
-
6
-
7
-
8
-
9
-
10
-
11
-
12
-
13
-
14
-
15
-
16
-
17
-
18
-
19
-
20
-
21
-
22
-
23
-
24
-
25
-
26
-
27
-
28
-
29
-
30
-
31
-
32
-
33
-
34
-
35
-
36
-
37
-
38
-
39
-
40
-
41
-
42
-
43
-
44
-
45
-
46
-
47
-
48
-
49
-
50
-
51
-
52
-
53
-
54
-
55
-
56
-
57
-
58
-
59
-
60
-
61
-
62
-
63
-
64
-
65
-
66
-
67
-
68
-
69
-
70
-
71
-
72
-
73
-
74
-
75
-
76
-
77
-
78
-
79
-
80
-
81
-
82
-
83
-
84
-
85
-
86
-
87
-
88
-
89
-
90
-
91
-
92
-
93
-
94
-
95
-
96
-
97
-
98
-
99
-
100
-
101
-
102
-
103
-
104
-
 105
105 -
 106
106 -
 107
107 -
 108
108 -
 109
109 -
 110
110 -
 111
111 -
 112
112 -
 113
113 -
 114
114 -
 115
115 -
 116
116 -
 117
117 -
 118
118 -
 119
119 -
 120
120 -
 121
121 -
 122
122 -
 123
123 -
 124
124 -
 125
125 -
126
-
127
-
128
 |
 |

A n n u a l R e p o r t 2 0 0 8 113
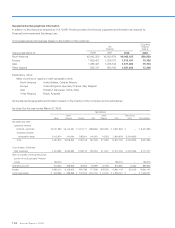
Yen (millions)
2007 2008
Years ended March 31, 2007 and 2008
Non-financial
services
businesses
Finance
subsidiaries
Reconciling
items Consolidated
Non-financial
services
businesses
Finance
subsidiaries
Reconciling
items Consolidated
Cash flows from operating activities:
Net income
¥ 537,186 ¥ 55,149 ¥ (13) ¥ 592,322 ¥ 580,728 ¥ 19,323 ¥ (12) ¥ 600,039
Adjustments to reconcile net income to
net cash provided by operating activities:
Depreciation
360,812 10,676 — 371,488 416,438 101,987 — 518,425
Deferred income taxes
(35,483) 19,035 — (16,448) 7,612 23,729 — 31,341
Minority interests in income
20,102 15 — 20,117 27,280 28 — 27,308
Equity in income of affiliates
(103,417) — — (103,417) (118,942) — — (118,942)
Dividends from affiliates
54,849 — — 54,849 67,764 — — 67,764
Loss (gain) on derivative instruments, net
28,370 28,466 — 56,836 (14,020) 84,271 — 70,251
Decrease (increase) in trade accounts
and notes receivable
(5,445) (34,318) (9,766) (49,529) (57,164) (9,996) (536) (67,696)
Decrease (increase) in inventories
(96,839) — — (96,839) (100,622) — — (100,622)
Increase (decrease) in trade accounts
and notes payable
41,965 — (3,779) 38,186 19,299 — 13,028 32,327
Other, net
8,613 14,185 14,162 36,960 107,626 1,342 (42,245) 66,723
Net cash provided by operating activities
810,713 93,208 604 904,525 935,999 220,684 (29,765) 1,126,918
Cash flows from investing activities:
Decrease (increase) in investments
and advances
93,311 — (40,957) 52,354 (87,073) — 96,486 9,413
Capital expenditures
(597,025) (933) — (597,958) (667,601) (627) — (668,228)
Proceeds from sales of property,
plant and equipment
20,364 277 — 20,641 26,476 392 — 26,868
Decrease (increase) in finance
subsidiaries—receivables
— (256,274) 16,052 (240,222) — (227,525) (14,442) (241,967)
Purchase of operating lease assets
— (366,795) — (366,795) — (839,261) — (839,261)
Proceeds from sales of operating lease assets
— 1,276 — 1,276 — 26,776 — 26,776
Net cash used in investing activities
(483,350) (622,449) (24,905) (1,130,704) (728,198) (1,040,245) 82,044 (1,686,399)
Cash flows from financing activities:
Increase (decrease) in short-term debt, net
32,964 241,349 31,750 306,063 98,926 548,993 (45,962) 601,957
Proceeds from long-term debt
25,424 949,360 (5,293) 969,491 32,387 1,032,504 (3,099) 1,061,792
Repayment of long-term debt
(18,077) (664,906) 5,444 (677,539) (24,918) (760,750) 2,919 (782,749)
Proceeds from issuance of common stock
— 7,613 (7,613) — — 6,149 (6,149) —
Cash dividends paid
(140,495) — 13 (140,482) (152,602) — 12 (152,590)
Cash dividends paid to minority interests
(7,434) — — (7,434) (9,663) — — (9,663)
Payment for purchase of treasury stock, net
(26,689) — — (26,689) (30,746) — — (30,746)
Net cash provided by (used in)
financing activities
(134,307) 533,416 24,301 423,410 (86,616) 826,896 (52,279) 688,001
Effect of exchange rate changes on cash
and cash equivalents
31,057 470 — 31,527 (20,028) (3,136) — (23,164)
Net change in cash and cash equivalents
224,113 4,645 — 228,758 101,157 4,199 — 105,356
Cash and cash equivalents at beginning of period
697,196 19,592 — 716,788 921,309 24,237 — 945,546
Cash and cash equivalents at end of period
¥ 921,309 ¥ 24,237 ¥ — ¥ 945,546 ¥1,022,466 ¥ 28,436 ¥ — ¥ 1,050,902
Notes:
1. Non-financial services businesses lend to finance subsidiaries. These cash flows are included in the decrease (increase) in investments and advances, increase (decrease) in
short-term debt, proceeds from long-term debt, and repayment of long-term debt. The amount of the loans to finance subsidiaries is a ¥48,570 million decrease for the fiscal
year ended March 31, 2007, and a ¥90,337 million increase for the fiscal year ended March 31, 2008, respectively.
2. Decrease (increase) in trade accounts and notes receivable for finance subsidiaries is due to the reclassification of finance subsidiaries—receivables which relate to sales of
inventory in the unaudited consolidated statements of cash flows presented above.
Consolidated Statements of Cash Flows Divided into Non-Financial
Services Businesses and Finance Subsidiaries (Unaudited)