Honda 2008 Annual Report Download - page 108
Download and view the complete annual report
Please find page 108 of the 2008 Honda annual report below. You can navigate through the pages in the report by either clicking on the pages listed below, or by using the keyword search tool below to find specific information within the annual report.-
 1
1 -
2
-
3
-
4
-
5
-
6
-
7
-
8
-
9
-
10
-
11
-
12
-
13
-
14
-
15
-
16
-
17
-
18
-
19
-
20
-
21
-
22
-
23
-
24
-
25
-
26
-
27
-
28
-
29
-
30
-
31
-
32
-
33
-
34
-
35
-
36
-
37
-
38
-
39
-
40
-
41
-
42
-
43
-
44
-
45
-
46
-
47
-
48
-
49
-
50
-
51
-
52
-
53
-
54
-
55
-
56
-
57
-
58
-
59
-
60
-
61
-
62
-
63
-
64
-
65
-
66
-
67
-
68
-
69
-
70
-
71
-
72
-
73
-
74
-
75
-
76
-
77
-
78
-
79
-
80
-
81
-
82
-
83
-
84
-
85
-
86
-
87
-
88
-
89
-
90
-
91
-
92
-
93
-
94
-
95
-
96
-
97
-
 98
98 -
 99
99 -
 100
100 -
 101
101 -
 102
102 -
 103
103 -
 104
104 -
 105
105 -
 106
106 -
 107
107 -
 108
108 -
 109
109 -
 110
110 -
 111
111 -
 112
112 -
 113
113 -
 114
114 -
 115
115 -
 116
116 -
 117
117 -
 118
118 -
119
-
120
-
121
-
122
-
123
-
124
-
125
-
126
-
127
-
128
 |
 |

A n n u a l R e p o r t 2 0 0 8
106
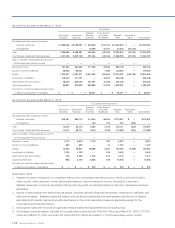
As of and for the year ended March 31, 2008
U.S dollars (millions) (note 2)
Japan
North
America Europe Asia
Other
Regions Total
Reconciling
Items Consolidated
Net sales and other
operating revenue:
External customers
$20,495 $60,800 $ 14,994 $13,047 $10,465 $119,801 $ — $119,801
Transfers between
geographic areas
28,303 1,734 918 3,305 442 34,702 (34,702) —
Total
48,798 62,534 15,912 16,352 10,907 154,503 (34,702) 119,801
Cost of sales, SG&A and
R&D expenses
46,876 58,216 15,398 15,047 9,744 145,281 (34,993) 110,288
Gain on transfer of the substitutional
portion of the Employees’ Pension
Funds to the government
— — — — — — — —
Operating income
1,922 4,318 514 1,305 1,163 9,222 291 9,513
Assets
31,212 68,510 9,467 10,784 5,738 125,711 205 125,916
Long-lived assets
$10,821 $15,864 $ 1,707 $ 2,596 $ 1,279 $ 32,267 $ — $ 32,267
Explanatory notes:
1. Major countries or regions in each geographic area:
North America United States, Canada, Mexico
Europe United Kingdom, Germany,
France, Italy, Belgium
Asia Thailand, Indonesia, China, India
Other Regions Brazil, Australia
2. Operating income of each geographical region is measured in a consistent manner with consolidated operating income,
which is net income before other income, other expenses, income tax (benefit) expense, minority interest in income, and
equity in income of affiliates.
3. Assets of each geographical region are defined as total assets, including derivative financial instruments, investments in
affiliates, and deferred tax assets.
4. Sales and revenues between geographic areas are generally made at values that approximate arm’s-length prices.
5. Unallocated corporate assets, included in reconciling items, amounted to ¥354,903 million as of March 31, 2006, ¥377,873
million as of March 31, 2007, and ¥385,442 million ($3,847 million) as of March 31, 2008 respectively, which consist primarily
of cash and cash equivalents and marketable securities held by the Company. Reconciling items also include elimination of
transactions between geographic areas.