Honda 2008 Annual Report Download - page 76
Download and view the complete annual report
Please find page 76 of the 2008 Honda annual report below. You can navigate through the pages in the report by either clicking on the pages listed below, or by using the keyword search tool below to find specific information within the annual report.-
 1
1 -
2
-
3
-
4
-
5
-
6
-
7
-
8
-
9
-
10
-
11
-
12
-
13
-
14
-
15
-
16
-
17
-
18
-
19
-
20
-
21
-
22
-
23
-
24
-
25
-
26
-
27
-
28
-
29
-
30
-
31
-
32
-
33
-
34
-
35
-
36
-
37
-
38
-
39
-
40
-
41
-
42
-
43
-
44
-
45
-
46
-
47
-
48
-
49
-
50
-
51
-
52
-
53
-
54
-
55
-
56
-
57
-
58
-
59
-
60
-
61
-
62
-
63
-
64
-
65
-
 66
66 -
 67
67 -
 68
68 -
 69
69 -
 70
70 -
 71
71 -
 72
72 -
 73
73 -
 74
74 -
 75
75 -
 76
76 -
 77
77 -
 78
78 -
 79
79 -
 80
80 -
 81
81 -
 82
82 -
 83
83 -
 84
84 -
 85
85 -
 86
86 -
87
-
88
-
89
-
90
-
91
-
92
-
93
-
94
-
95
-
96
-
97
-
98
-
99
-
100
-
101
-
102
-
103
-
104
-
105
-
106
-
107
-
108
-
109
-
110
-
111
-
112
-
113
-
114
-
115
-
116
-
117
-
118
-
119
-
120
-
121
-
122
-
123
-
124
-
125
-
126
-
127
-
128
 |
 |

A n n u a l R e p o r t 2 0 0 8
7 4
Finance subsidiaries—receivables represent finance
receivables generated by finance subsidiaries. Certain
finance receivables related to sales of inventory are included
in trade receivables and other assets in the consolidated
balance sheets. Finance receivables include wholesale
financing to dealers and retail financing and direct financing
leases to consumers.
The allowance for credit losses is maintained at an
amount management deems adequate to cover estimated
losses on finance receivables. The allowance is based on
management’s evaluation of many factors, including current
economic trends, industry experience, inherent risks in the
portfolio and the borrower’s ability to pay.
Finance subsidiaries of the Company purchase
insurance to cover a substantial amount of the estimated
residual value of vehicles leased as direct financing leases
to customers. The allowance for losses on lease residual
values is maintained at an amount management deems
adequate to cover estimated losses on the uninsured portion
of the vehicles’ lease residual values. The allowance is
also based on management’s evaluation of many factors,
including current economic conditions, industry experience
and the finance subsidiaries’ historical experience with
residual value losses.
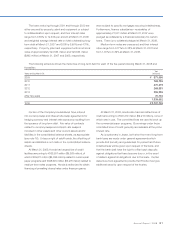
4. Finance Subsidiaries—Receivables and Securitizations
Finance subsidiaries—receivables, net, consisted of the following at March 31, 2007 and 2008:
Yen
(millions)
U.S. dollars
(millions)
(note 2)
2007 2008 2008
Direct financing leases ¥1,892,566 ¥1,212,634 $12,103
Retail 2,923,944 3,143,376 31,374
Wholesale 437,242 404,433 4,037
Term loans to dealers 14,916 19,605 196
Total finance receivables 5,268,668 4,780,048 47,710
Retained interests in the sold pools of finance receivables 88,110 54,636 545
5,356,778 4,834,684 48,255
Less:
Allowance for credit losses 35,020 34,805 347
Allowance for losses on lease residual values 33,928 24,887 248
Unearned interest income and fees 143,131 73,695 736
5,144,699 4,701,297 46,924
Less:
Finance receivables included in trade receivables, net 509,697 476,305 4,754
Finance receivables included in other assets, net 168,952 176,444 1,761
Finance subsidiaries—receivables, net 4,466,050 4,048,548 40,409
Less current portion 1,426,224 1,340,728 13,382
Noncurrent finance subsidiaries—receivables, net ¥3,039,826 ¥2,707,820 $27,027
The following schedule shows the contractual maturities of finance receivables for each of the five years following March
31, 2008 and thereafter:
Years ending March 31
Yen
(millions)
2009 ¥1,854,779
2010 1,192,229
2011 820,283
2012 576,389
2013 274,965
After five years 61,403
2,925,269
Total ¥4,780,048