Honda 2008 Annual Report Download - page 78
Download and view the complete annual report
Please find page 78 of the 2008 Honda annual report below. You can navigate through the pages in the report by either clicking on the pages listed below, or by using the keyword search tool below to find specific information within the annual report.-
 1
1 -
2
-
3
-
4
-
5
-
6
-
7
-
8
-
9
-
10
-
11
-
12
-
13
-
14
-
15
-
16
-
17
-
18
-
19
-
20
-
21
-
22
-
23
-
24
-
25
-
26
-
27
-
28
-
29
-
30
-
31
-
32
-
33
-
34
-
35
-
36
-
37
-
38
-
39
-
40
-
41
-
42
-
43
-
44
-
45
-
46
-
47
-
48
-
49
-
50
-
51
-
52
-
53
-
54
-
55
-
56
-
57
-
58
-
59
-
60
-
61
-
62
-
63
-
64
-
65
-
66
-
67
-
 68
68 -
 69
69 -
 70
70 -
 71
71 -
 72
72 -
 73
73 -
 74
74 -
 75
75 -
 76
76 -
 77
77 -
 78
78 -
 79
79 -
 80
80 -
 81
81 -
 82
82 -
 83
83 -
 84
84 -
 85
85 -
 86
86 -
 87
87 -
 88
88 -
89
-
90
-
91
-
92
-
93
-
94
-
95
-
96
-
97
-
98
-
99
-
100
-
101
-
102
-
103
-
104
-
105
-
106
-
107
-
108
-
109
-
110
-
111
-
112
-
113
-
114
-
115
-
116
-
117
-
118
-
119
-
120
-
121
-
122
-
123
-
124
-
125
-
126
-
127
-
128
 |
 |

A n n u a l R e p o r t 2 0 0 8
7 6
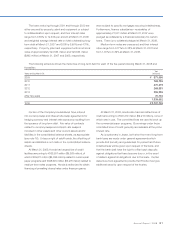
The following illustration presents quantitative information about balances of outstanding securitized portfolios as of
March 31, 2007 and 2008.
Yen
(millions)
U.S. dollars
(millions)
(note 2)
2007 2008 2008
Securitized receivables
Retail ¥1,208,409 ¥ 664,879 $6,636
Direct financing leases 67,758 33,470 334
Total securitized receivables ¥1,276,167 ¥ 698,349 $6,970
5. Inventories
Inventories at March 31, 2007 and 2008 are summarized as follows:
Yen
(millions)
U.S. dollars
(millions)
(note 2)
2007 2008 2008
Finished goods ¥ 772,917 ¥ 755,122 $ 7,537
Work in process 34,970 38,756 387
Raw materials 375,229 405,382 4,046
¥1,183,116 ¥1,199,260 $11,970
6. Investments and Advances—Affiliates
Significant investments in affiliates accounted for under
the equity method at March 31, 2007 and 2008 are Showa
Corporation (33.5%), Keihin Corporation (42.2%), Guangzhou
Honda Automobile Co., Ltd. (50.0%), Dongfeng Honda
Engine Co., Ltd. (50.0%), and P.T. Astra Honda Motor
(50.0%).
Certain adjustments were recorded to investments and
advances to affiliates as of April 1, 2006, please refer to note
1(u) for further information.
The difference between the carrying amount of
investment in affiliates and the amount of underlying equity in
net assets is not material as of March 31, 2007 and 2008.
Investments in affiliates include equity securities which have quoted market values at March 31, 2007 and 2008 compared
with related carrying amounts as follows:
Yen
(millions)
U.S. dollars
(millions)
(note 2)
2007* 2008 2008
Carrying amount ¥185,914 ¥ 210,532 $2,101
Market value 412,892 263,946 2,634
* See note 3.