Honda 2008 Annual Report Download - page 61
Download and view the complete annual report
Please find page 61 of the 2008 Honda annual report below. You can navigate through the pages in the report by either clicking on the pages listed below, or by using the keyword search tool below to find specific information within the annual report.-
 1
1 -
2
-
3
-
4
-
5
-
6
-
7
-
8
-
9
-
10
-
11
-
12
-
13
-
14
-
15
-
16
-
17
-
18
-
19
-
20
-
21
-
22
-
23
-
24
-
25
-
26
-
27
-
28
-
29
-
30
-
31
-
32
-
33
-
34
-
35
-
36
-
37
-
38
-
39
-
40
-
41
-
42
-
43
-
44
-
45
-
46
-
47
-
48
-
49
-
50
-
 51
51 -
 52
52 -
 53
53 -
 54
54 -
 55
55 -
 56
56 -
 57
57 -
 58
58 -
 59
59 -
 60
60 -
 61
61 -
 62
62 -
 63
63 -
 64
64 -
 65
65 -
 66
66 -
 67
67 -
 68
68 -
 69
69 -
 70
70 -
 71
71 -
72
-
73
-
74
-
75
-
76
-
77
-
78
-
79
-
80
-
81
-
82
-
83
-
84
-
85
-
86
-
87
-
88
-
89
-
90
-
91
-
92
-
93
-
94
-
95
-
96
-
97
-
98
-
99
-
100
-
101
-
102
-
103
-
104
-
105
-
106
-
107
-
108
-
109
-
110
-
111
-
112
-
113
-
114
-
115
-
116
-
117
-
118
-
119
-
120
-
121
-
122
-
123
-
124
-
125
-
126
-
127
-
128
 |
 |

A n n u a l R e p o r t 2 0 0 8 5 9
Foreign currency forward exchange contracts and purchased
option contracts are normally used to hedge sale commitments
denominated in foreign currencies (principally U.S. dollars).
Foreign currency written option contracts are entered into in
combination with purchased option contracts to offset premium
amounts to be paid for purchased option contracts.
The tables on the previous page provide information about
our derivatives related to foreign currency exchange rate risk as of
March 31, 2007 and 2008. For forward exchange contracts and
currency options, the table presents the contract amounts and fair
value. All forward exchange contracts and currency contracts to
which we are a party have original maturities of less than one year.
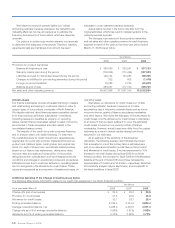
(Interest Rate Risks)
Honda is exposed to market risk for changes in interest rates
related primarily to its debt obligations and finance receivables.
In addition to short-term financing such as commercial paper,
Honda has long-term debt with both fixed and floating rates. Our
finance receivables are primarily fixed rate. Interest rate swap
agreements are mainly used to convert floating rate financing
(normally three-five years) to fixed rate financing in order to match
financing costs with income from finance receivables. Foreign
currency and interest rate swap agreements used among different
currencies, also serve to hedge foreign currency exchange risk as
well as interest rate risk.
The following tables provide information about Honda’s
financial instruments that were sensitive to changes in interest
rates at March 31, 2007 and 2008. For finance receivables and
long-term debt, these tables present principal cash flows, fair
value and related weighted average interest rates. For interest rate
swaps and currency and interest rate swaps, the table presents
notional amounts, fair value and weighted average interest rates.
Variable interest rates are determined using formulas such as
LIBOR+α and an index.
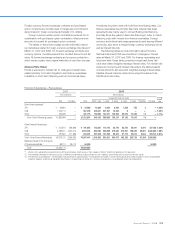
Finance Subsidiaries—Receivables
2007 2008
Yen (millions) Yen (millions)
Expected maturity date
Average
interest
rate
Total Fair value Total Within 1 year 1-2 year 2-3 year 3-4 year 4-5 year Thereafter Fair value
Direct financing leases*1
JP¥ ¥ 26,894 — ¥ 23,580 13,259 5,090 2,946 1,528 755 2 — 4.62%
US$ 1,426,173 — 657,278 402,007 241,201 14,062 8 — — — 5.40%
Other 439,499 — 531,776 133,930 142,577 149,202 92,570 13,485 12 —4.17%
Total—Direct Financing Leases ¥ 1,892,566 — ¥1,212,634 549,196 388,868 166,210 94,106 14,240 14 —
Other Finance Receivables:
JP¥ ¥ 402,970 398,869 ¥ 441,695 145,881 113,143 82,716 53,570 40,091 6,294 437,032 4.62%
US$ 2,485,210 2,545,210 2,515,518 862,084 558,698 475,684 370,941 198,020 50,091 2,645,690 7.66%
Other 487,922 411,955 610,201 297,618 131,520 95,673 57,772 22,614 5,004 524,144 6.87%
Total—Other Finance Receivables ¥3,376,102 3,356,034 ¥3,567,414 1,305,583 803,361 654,073 482,283 260,725 61,389 3,606,866
Retained interest in the sold pools
of finance receivables*2 88,110 88,110 54,636 54,636
Total*3 ¥ 5,356,778 ¥4,834,684
*1 : Under U.S. generally accepted accounting principles, disclosure of fair values of direct financing leases is not required.
*2 : The retained interest in the sold pools of finance receivables is accounted for as “trading” securities and is reported at fair value.
*3 : The finance subsidiaries—receivables include finance subsidiaries—receivables included in trade receivables and other assets in the consolidated
balance sheets. Additional detailed information is described in Note 4 to the accompanying consolidated financial statements.