Honda 2008 Annual Report Download - page 50
Download and view the complete annual report
Please find page 50 of the 2008 Honda annual report below. You can navigate through the pages in the report by either clicking on the pages listed below, or by using the keyword search tool below to find specific information within the annual report.-
 1
1 -
2
-
3
-
4
-
5
-
6
-
7
-
8
-
9
-
10
-
11
-
12
-
13
-
14
-
15
-
16
-
17
-
18
-
19
-
20
-
21
-
22
-
23
-
24
-
25
-
26
-
27
-
28
-
29
-
30
-
31
-
32
-
33
-
34
-
35
-
36
-
37
-
38
-
39
-
 40
40 -
 41
41 -
 42
42 -
 43
43 -
 44
44 -
 45
45 -
 46
46 -
 47
47 -
 48
48 -
 49
49 -
 50
50 -
 51
51 -
 52
52 -
 53
53 -
 54
54 -
 55
55 -
 56
56 -
 57
57 -
 58
58 -
 59
59 -
 60
60 -
61
-
62
-
63
-
64
-
65
-
66
-
67
-
68
-
69
-
70
-
71
-
72
-
73
-
74
-
75
-
76
-
77
-
78
-
79
-
80
-
81
-
82
-
83
-
84
-
85
-
86
-
87
-
88
-
89
-
90
-
91
-
92
-
93
-
94
-
95
-
96
-
97
-
98
-
99
-
100
-
101
-
102
-
103
-
104
-
105
-
106
-
107
-
108
-
109
-
110
-
111
-
112
-
113
-
114
-
115
-
116
-
117
-
118
-
119
-
120
-
121
-
122
-
123
-
124
-
125
-
126
-
127
-
128
 |
 |

A n n u a l R e p o r t 2 0 0 8
4 8
Financial Review
Operating and Financial Review
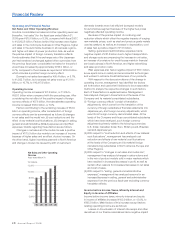
Net Sales and Other Operating Revenue
Honda’s consolidated net sales and other operating revenues
(hereafter, “net sales”) for the fiscal year ended March 31,
2008 grew ¥915.6 billion, or 8.3%, compared with fiscal 2007,
to ¥12,002.8 billion. Factors behind this increase were higher
unit sales in the motorcycle business in Other Regions, higher
unit sales in the automobile business in all overseas regions,
and higher unit sales of power products in Asia, as well as
the positive impact of foreign currency translation effects.
Honda estimates that if the exchange rate of the Japanese
yen had remained unchanged against other currencies from
the previous fiscal year, consolidated net sales for the period
would have increased by approximately ¥743.0 billion, or
6.7%, compared to the increase as reported of ¥915.6 billion,
which includes a positive foreign currency effect.
Domestic net sales decreased by ¥95.4 billion, or 5.7%,
to ¥1,585.7 billion, but overseas net sales were up ¥1,011.1
billion, or 10.7%, to ¥10,417.0 billion.
Operating Income
Operating income increased ¥101.2 billion, or 11.9% to
¥953.1 billion when compared with the preceding year. After
considering the net effect of the positive impact of foreign
currency effects of ¥37.6 billion, Honda estimates operating
income increased ¥63.5 billion, or 7.5%.
Factors contributing to the remaining increase of ¥63.5
billion in operating income, after consideration of foreign
currency effects can be summarized as follows (i) changes
in net sales and the model mix, (ii) cost reductions and the
effect of raw material cost fluctuations, (iii) changes in selling,
general and administrative (SG&A) expenses and (iv) R&D
expenses. Details regarding these factors are as follows.
Changes in net sales and the model mix was a positive
impact of ¥170.0 billion due mainly to an increase of income
because of higher sales and an effect of price increase. On
the other hand, higher incentives payment in North America
and change in model mix caused by shift of customers’
demands towards more fuel efficient (compact) models
for automobiles segment because of the higher fuel prices
negatively affected operating income.
Because of the positive impact of continuing cost
reduction effects which offset the negative impacts of surging
raw materials prices, such as steel and precious grade metals
used as catalyst, as well as an increase in depreciation, cost
of sales had a positive impact of ¥11.5 billion.
Selling, general and administrative expenses had a
negative impact of ¥81.8 billion due to higher transportation
and storage costs accompanying the increase in unit sales,
an increase of provisions for credit losses mainly in financial
services business in North America, and higher advertising
and sales promotion costs.
R&D expenses also had a negative impact of ¥36.1 billion,
as we spent more on safety and environmental technologies
and worked to enhance the attractiveness of our products.
With respect to the discussion above of the change in
operating income, management has identified the factors
set forth below and used what it believes to be a reasonable
method to analyze the respective changes in such factors.
Each of these factors is explained below. Management
has analyzed changes in these factors at the levels of the
Company and its material consolidated subsidiaries.
(1) “Foreign currency effects” consist of translation
adjustments, which come from the translation of the
currency of foreign subsidiaries’ financial statements into
Japanese yen, and foreign currency adjustments, which
result from foreign-currency-denominated sales. At the
levels of the Company and those consolidated subsidiaries
which have been analyzed, such foreign currency
adjustments primarily relate to the following currencies:
U.S. dollar, Canadian dollar, Euro, British pound, Brazilian
real and Japanese yen.
(2) With respect to “cost reduction and effects of raw material
cost fluctuations”, management has analyzed cost
reduction and effects of raw material cost fluctuations
at the levels of the Company and its material foreign
manufacturing subsidiaries in North America, Europe and
Other Regions.
(3) With respect to “changes in net sales and model mix”,
management has analyzed changes in sales volume and
in the mix of product models sold in major markets which
have resulted in increases/decreases in profit, as well as
certain other reasons for increases/decreases in net sales
and cost of sales.
(4) With respect to “selling, general and administrative
expenses”, management has analyzed reasons for an
increase/decrease in selling, general and administrative
expenses from the previous fiscal year excluding currency
translation effects.
Income before Income Taxes, Minority Interest and
Equity in Income of Affiliates
Income before income taxes, minority interest and equity
in income of affiliates increased ¥102.9 billion, or 13.0%, to
¥895.8 billion. Main factors of this increase except factors
relating operating income are as follows;
Losses on the valuation of interest rate swaps and other
derivatives of our finance subsidiaries had a negative impact
0
2,000
4,000
6,000
8,000
10,000
12,000
08_07_06_05_04_
Net Sales and Other Operating
Revenue
Years ended March 31
)snoillib(neY
0807060504