Honda 2008 Annual Report Download - page 106
Download and view the complete annual report
Please find page 106 of the 2008 Honda annual report below. You can navigate through the pages in the report by either clicking on the pages listed below, or by using the keyword search tool below to find specific information within the annual report.-
 1
1 -
2
-
3
-
4
-
5
-
6
-
7
-
8
-
9
-
10
-
11
-
12
-
13
-
14
-
15
-
16
-
17
-
18
-
19
-
20
-
21
-
22
-
23
-
24
-
25
-
26
-
27
-
28
-
29
-
30
-
31
-
32
-
33
-
34
-
35
-
36
-
37
-
38
-
39
-
40
-
41
-
42
-
43
-
44
-
45
-
46
-
47
-
48
-
49
-
50
-
51
-
52
-
53
-
54
-
55
-
56
-
57
-
58
-
59
-
60
-
61
-
62
-
63
-
64
-
65
-
66
-
67
-
68
-
69
-
70
-
71
-
72
-
73
-
74
-
75
-
76
-
77
-
78
-
79
-
80
-
81
-
82
-
83
-
84
-
85
-
86
-
87
-
88
-
89
-
90
-
91
-
92
-
93
-
94
-
95
-
 96
96 -
 97
97 -
 98
98 -
 99
99 -
 100
100 -
 101
101 -
 102
102 -
 103
103 -
 104
104 -
 105
105 -
 106
106 -
 107
107 -
 108
108 -
 109
109 -
 110
110 -
 111
111 -
 112
112 -
 113
113 -
 114
114 -
 115
115 -
 116
116 -
117
-
118
-
119
-
120
-
121
-
122
-
123
-
124
-
125
-
126
-
127
-
128
 |
 |

A n n u a l R e p o r t 2 0 0 8
104
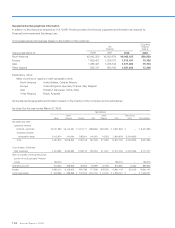
Supplemental Geographical Information
In addition to the disclosure required by U.S. GAAP, Honda provides the following supplemental information as required by
Financial Instruments and Exchange Law:
(1) Overseas sales and revenues based on the location of the customer
Yen
(millions)
U.S dollars
(millions)
(note 2)
Years ended March 31: 2006 2007 2008 2008
North America ¥5,463,359 ¥5,980,876 ¥6,068,425 $60,569
Europe 1,009,421 1,236,757 1,519,434 15,165
Asia 1,085,451 1,283,154 1,577,266 15,743
Other regions 655,721 905,163 1,251,932 12,496
Explanatory notes:
Major countries or regions in each geographic area:
North America United States, Canada, Mexico
Europe United Kingdom, Germany, France, Italy, Belgium
Asia Thailand, Indonesia, China, India
Other Regions Brazil, Australia
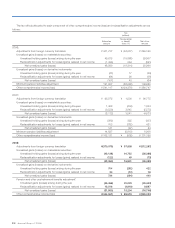
(2) Supplemental geographical information based on the location of the Company and its subsidiaries
As of and for the year ended March 31, 2006
Yen (millions)
Japan
North
America Europe Asia
Other
Regions Total
Reconciling
Items Consolidated
Net sales and other
operating revenue:
External customers ¥2,021,999 ¥5,475,261 ¥1,001,177 ¥856,892 ¥552,667 ¥ 9,907,996 ¥ — ¥ 9,907,996
Transfers between
geographic areas 2,415,874 141,064 188,341 140,501 19,023 2,904,803 (2,904,803) —
Total 4,437,873 5,616,325 1,189,518 997,393 571,690 12,812,799 (2,904,803) 9,907,996
Cost of sales, SG&A and
R&D expenses 4,204,939 5,262,382 1,163,213 932,394 514,527 12,077,455 (2,900,348) 9,177,107
Gain on transfer of the substitutional
portion of the Employees’ Pension
Funds 138,016 — — — — 138,016 — 138,016
Operating income 370,950 353,943 26,305 64,999 57,163 873,360 (4,455) 868,905
Assets 2,695,212 6,128,303 800,786 717,933 309,209 10,651,443 (20,043) 10,631,400
Long-lived assets ¥ 949,358 ¥ 589,596 ¥ 157,819 ¥157,704 ¥ 72,244 ¥ 1,926,721 ¥ — ¥ 1,926,721