Honda 2008 Annual Report Download - page 114
Download and view the complete annual report
Please find page 114 of the 2008 Honda annual report below. You can navigate through the pages in the report by either clicking on the pages listed below, or by using the keyword search tool below to find specific information within the annual report.-
 1
1 -
2
-
3
-
4
-
5
-
6
-
7
-
8
-
9
-
10
-
11
-
12
-
13
-
14
-
15
-
16
-
17
-
18
-
19
-
20
-
21
-
22
-
23
-
24
-
25
-
26
-
27
-
28
-
29
-
30
-
31
-
32
-
33
-
34
-
35
-
36
-
37
-
38
-
39
-
40
-
41
-
42
-
43
-
44
-
45
-
46
-
47
-
48
-
49
-
50
-
51
-
52
-
53
-
54
-
55
-
56
-
57
-
58
-
59
-
60
-
61
-
62
-
63
-
64
-
65
-
66
-
67
-
68
-
69
-
70
-
71
-
72
-
73
-
74
-
75
-
76
-
77
-
78
-
79
-
80
-
81
-
82
-
83
-
84
-
85
-
86
-
87
-
88
-
89
-
90
-
91
-
92
-
93
-
94
-
95
-
96
-
97
-
98
-
99
-
100
-
101
-
102
-
103
-
 104
104 -
 105
105 -
 106
106 -
 107
107 -
 108
108 -
 109
109 -
 110
110 -
 111
111 -
 112
112 -
 113
113 -
 114
114 -
 115
115 -
 116
116 -
 117
117 -
 118
118 -
 119
119 -
 120
120 -
 121
121 -
 122
122 -
 123
123 -
 124
124 -
125
-
126
-
127
-
128
 |
 |

A n n u a l R e p o r t 2 0 0 8
112
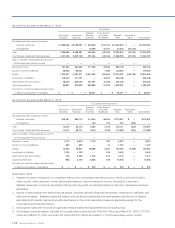
Consolidated Balance Sheets Divided into Non-Financial Services
Businesses and Finance Subsidiaries (Unaudited)
Yen (millions)
At March 31, 2007 and 2008 2007 2008
Assets
Non-financial services businesses
Current assets: ¥ 4,049,885 ¥ 4,091,060
Cash and cash equivalents 921,309 1,022,466
Trade accounts and notes receivable, net 546,790 552,442
Inventories 1,183,116 1,199,260
Other current assets 1,398,670 1,316,892
Investments and advances 1,023,014 1,023,113
Property, plant and equipment, net 2,059,514 2,183,220
Other assets 417,325 530,156
Total assets 7,549,738 7,827,549
Finance Subsidiaries
Cash and cash equivalents 24,237 28,436
Finance subsidiaries—short-term receivables, net 1,451,606 1,351,867
Finance subsidiaries—long-term receivables, net 3,040,572 2,708,367
Net property on operating leases 336,209 918,972
Other assets 841,580 900,197
Total assets 5,694,204 5,907,839
Reconciling items (1,207,442) (1,119,845)
Total assets ¥12,036,500 ¥12,615,543
Liabilities, Minority Interests and Stockholders’ Equity
Non-financial services businesses
Current liabilities: ¥ 2,359,648 ¥ 2,307,339
Short-term debt 243,487 324,507
Current portion of long-term debt 19,713 20,486
Trade payables 1,182,894 1,057,446
Accrued expenses 671,467 632,506
Other current liabilities 242,087 272,394
Long-term debt, excluding current portion 55,468 56,225
Other liabilities 910,966 1,121,208
Total liabilities 3,326,082 3,484,772
Finance Subsidiaries
Short-term debt 1,842,119 2,128,442
Current portion of long-term debt 758,855 863,797
Accrued expenses 178,236 148,276
Long-term debt, excluding current portion 1,869,470 1,786,744
Other liabilities 421,673 408,803
Total liabilities 5,070,353 5,336,062
Reconciling items (965,453) (891,362)
Total liabilities 7,430,982 7,929,472
Minority interests in consolidated subsidiaries 122,907 141,806
Common stock 86,067 86,067
Capital surplus 172,529 172,529
Legal reserves 37,730 39,811
Retained earnings 4,654,890 5,099,983
Accumulated other comprehensive income (loss), net (427,166) (782,198)
Treasury stock (41,439) (71,927)
Total stockholders’ equity 4,482,611 4,544,265
Total liabilities, minority interests and stockholders’ equity ¥12,036,500 ¥12,615,543
Note: See note 3 to the consolidated financial statements.