Honda 2008 Annual Report Download - page 103
Download and view the complete annual report
Please find page 103 of the 2008 Honda annual report below. You can navigate through the pages in the report by either clicking on the pages listed below, or by using the keyword search tool below to find specific information within the annual report.-
 1
1 -
2
-
3
-
4
-
5
-
6
-
7
-
8
-
9
-
10
-
11
-
12
-
13
-
14
-
15
-
16
-
17
-
18
-
19
-
20
-
21
-
22
-
23
-
24
-
25
-
26
-
27
-
28
-
29
-
30
-
31
-
32
-
33
-
34
-
35
-
36
-
37
-
38
-
39
-
40
-
41
-
42
-
43
-
44
-
45
-
46
-
47
-
48
-
49
-
50
-
51
-
52
-
53
-
54
-
55
-
56
-
57
-
58
-
59
-
60
-
61
-
62
-
63
-
64
-
65
-
66
-
67
-
68
-
69
-
70
-
71
-
72
-
73
-
74
-
75
-
76
-
77
-
78
-
79
-
80
-
81
-
82
-
83
-
84
-
85
-
86
-
87
-
88
-
89
-
90
-
91
-
92
-
 93
93 -
 94
94 -
 95
95 -
 96
96 -
 97
97 -
 98
98 -
 99
99 -
 100
100 -
 101
101 -
 102
102 -
 103
103 -
 104
104 -
 105
105 -
 106
106 -
 107
107 -
 108
108 -
 109
109 -
 110
110 -
 111
111 -
 112
112 -
 113
113 -
114
-
115
-
116
-
117
-
118
-
119
-
120
-
121
-
122
-
123
-
124
-
125
-
126
-
127
-
128
 |
 |

A n n u a l R e p o r t 2 0 0 8 101
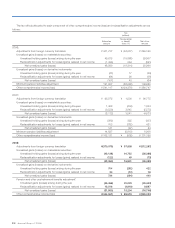
Segment Information
As of and for the year ended March 31, 2006
Yen (millions)
Motorcycle
Business
Automobile
Business
Financial
Services
Business
Power Product
and Other
Businesses
Segment
Total
Reconciling
Items Consolidated
Net sales and other operating revenue:
External customers ¥1,225,812 ¥8,004,694 ¥ 306,869 ¥370,621 ¥ 9,907,996 ¥ — ¥ 9,907,996
Intersegment — — 4,068 11,941 16,009 (16,009) —
Total 1,225,812 8,004,694 310,937 382,562 9,924,005 (16,009) 9,907,996
Cost of sales, SG&A and R&D expenses 1,127,157 7,492,257 220,352 353,350 9,193,116 (16,009) 9,177,107
Gain on transfer of the substitutional portion of
the Employee’s Pension Funds 15,319 115,935 — 6,762 138,016 — 138,016
Segment income 113,974 628,372 90,585 35,974 868,905 — 868,905
Equity in income of affiliates 30,700 67,439 — 1,466 99,605 — 99,605
Assets 1,006,308 4,843,148 5,008,718 294,170 11,152,344 (520,944) 10,631,400
Investments in affiliates 95,978 305,339 — 13,194 414,511 — 414,511
Depreciation and amortization 30,232 222,165 771 9,057 262,225 — 262,225
Capital expenditures 52,246 392,934 1,316 11,345 457,841 — 457,841
Provision for credit and lease residual losses
on finance subsidiaries—receivables ¥ — ¥ — ¥ 36,153 ¥ — ¥ 36,153 ¥ — ¥ 36,153
As of and for the year ended March 31, 2007
Yen (millions)
Motorcycle
Business
Automobile
Business
Financial
Services
Business
Power Product
and Other
Businesses
Segment
Total
Reconciling
Items Consolidated
Net sales and other operating revenue:
External customers ¥1,370,617 ¥8,889,080 ¥ 409,701 ¥417,742 ¥11,087,140 ¥ — ¥11,087,140
Intersegment — — 3,633 21,168 24,801 (24,801) —
Total 1,370,617 8,889,080 413,334 438,910 11,111,941 (24,801) 11,087,140
Cost of sales, SG&A and R&D expenses 1,270,009 8,289,537 297,792 402,724 10,260,062 (24,801) 10,235,261
Gain on transfer of the substitutional portion of
the Employee’s Pension Funds — — — — — — —
Segment income 100,608 599,543 115,542 36,186 851,879 — 851,879
Equity in income of affiliates 23,380 78,537 — 1,500 103,417 — 103,417
Assets 1,161,707 5,437,709 5,694,204 338,671 12,632,291 (595,791) 12,036,500
Investments in affiliates 118,475 360,673 — 15,065 494,213 — 494,213
Depreciation and amortization 40,576 309,877 10,676 10,359 371,488 — 371,488
Capital expenditures 68,880 540,859 367,728 16,394 993,861 — 993,861
Provision for credit and lease residual losses
on finance subsidiaries—receivables ¥ — ¥ — ¥ 44,128 ¥ — ¥ 44,128 ¥ — ¥ 44,128