Honda 2008 Annual Report Download - page 62
Download and view the complete annual report
Please find page 62 of the 2008 Honda annual report below. You can navigate through the pages in the report by either clicking on the pages listed below, or by using the keyword search tool below to find specific information within the annual report.-
 1
1 -
2
-
3
-
4
-
5
-
6
-
7
-
8
-
9
-
10
-
11
-
12
-
13
-
14
-
15
-
16
-
17
-
18
-
19
-
20
-
21
-
22
-
23
-
24
-
25
-
26
-
27
-
28
-
29
-
30
-
31
-
32
-
33
-
34
-
35
-
36
-
37
-
38
-
39
-
40
-
41
-
42
-
43
-
44
-
45
-
46
-
47
-
48
-
49
-
50
-
51
-
 52
52 -
 53
53 -
 54
54 -
 55
55 -
 56
56 -
 57
57 -
 58
58 -
 59
59 -
 60
60 -
 61
61 -
 62
62 -
 63
63 -
 64
64 -
 65
65 -
 66
66 -
 67
67 -
 68
68 -
 69
69 -
 70
70 -
 71
71 -
 72
72 -
73
-
74
-
75
-
76
-
77
-
78
-
79
-
80
-
81
-
82
-
83
-
84
-
85
-
86
-
87
-
88
-
89
-
90
-
91
-
92
-
93
-
94
-
95
-
96
-
97
-
98
-
99
-
100
-
101
-
102
-
103
-
104
-
105
-
106
-
107
-
108
-
109
-
110
-
111
-
112
-
113
-
114
-
115
-
116
-
117
-
118
-
119
-
120
-
121
-
122
-
123
-
124
-
125
-
126
-
127
-
128
 |
 |

A n n u a l R e p o r t 2 0 0 8
6 0
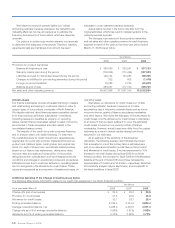
Long-Term Debt (including current portion)
2007 2008
Yen (millions) Yen (millions)
Expected maturity date
Average
interest
rate
Total Fair value Total Within 1 year 1-2 year 2-3 year 3-4 year 4-5 year Thereafter Fair value
J
apanese yen bonds ¥ 230,129 229,379 ¥ 250,080 30,049 60,049 59,995 69,992 29,995 — 251,166 1.11%
Japanese yen medium-term notes (Fixed rate)
367,900 368,425 321,600 111,400 73,000 76,000 32,900 25,300 3,000 324,504 1.03%
Japanese yen medium-term notes (Floating rate)
85,200 85,525 165,000 38,000 23,000 28,900 16,500 58,600 — 166,308 1.17%
U.S. dollar medium-term notes
(Fixed rate)
354,500 357,121 274,346 91,783 75,232 52,161 35,108 — 20,062 286,869 4.55%
U.S. dollar medium-term notes
(Floating rate)
1,171,527 1,183,041 1,005,456 482,189 416,938 50,155 56,174 — — 1,010,974 3.36%
Loans and others—primarily fixed rate 471,896 471,384 691,220 117,629 121,566 203,608 58,307 182,040 8,070 701,228 4.29%
Total ¥2,681,152 2,694,875 ¥ 2,707,702 871,050 769,785 470,819 268,981 295,935 31,132 2,741,049
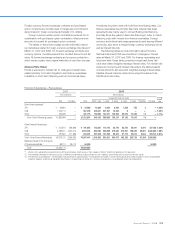
Interest Rate Swaps
2007 2008
Yen (millions) Yen (millions)
Notional
principal
currency
Expected maturity date
Average
receive
rate
Average
pay
rateReceive/Pay
Contract
amounts Fair value
Contract
amounts
Within
1 year 1-2 year 2-3 year 3-4 year 4-5 year Thereafter Fair value
JP¥ Float/Fix ¥ 5,858 — ¥ 2,330 1,512 218 600 — — — (4 ) 1.23% 1.42%
US$ Float/Fix 2,933,563 8,661 2,885,355 1,185,667 932,304 603,944 138,637 24,803 — (81,730) 3.35% 4.65%
Fix/Float 355,921 (1,878) 403,333 95,376 113,271 49,410 35,067 — 110,209 13,135 4.63% 3.34%
Float/Float 90,899 (205) 67,127 42,079 25,048 — — — — (36) 2.98% 3.14%
CA$ Float/Fix 490,691 2,186 658,179 210,821 187,138 144,604 87,055 24,379 4,182 (9,924) 3.88% 4.16%
Fix/Float 75,961 (346) 154,287 17,380 10,114 48,436 19,589 58,768 — 4,418 5.05% 4.40%
Float/Float 195,325 (302) 100,876 60,564 27,940 12,372 — — — (325) 3.61% 4.01%
GBP Float/Fix 48,314 333 23,469 12,133 6,123 5,213 — — — 83 5.99% 4.96%
Fix/Float 1,931 — — — — — — — — — — —
Total ¥4,198,463 8,449 ¥ 4,294,956 1,625,532 1,302,156 864,579 280,348 107,950 114,391 (74,383)
Currency & Interest Rate Swaps
2007 2008
Yen (millions) Yen (millions)
Receiving
side
currency
Paying
side
currency
Expected maturity date
Average
receive
rate
Average
pay
rateReceive/Pay
Contract
amounts Fair value
Contract
amounts
Within
1 year 1-2 year 2-3 year 3-4 year 4-5 year Thereafter Fair value
JP¥ US$ Fix/Float ¥386,064 (21,728) ¥ 286,141 100,705 66,733 66,976 27,749 21,162 2,816 37,036 1.03% 3.38%
Float/Float 87,414 (4,940) 153,023 44,006 18,621 24,997 14,374 51,025 — 19,641 1.15% 3.28%
JP¥ CA$ Fix/Float 2,790 (628) 2,685 — 2,685 — — — — (480) 0.95% 4.75%
Other Other Fix/Float 70,387 6,425 165,885 — — 59,738 — 106,147 — 34,731 4.58% 4.47%
Float/Float 61,879 3,334 55,279 19,071 36,208 — — — — 13,161 4.60% 2.73%
Total ¥608,534 (17,537) ¥ 663,013 163,782 124,247 151,711 42,123 178,334 2,816 104,089
(Equity Price Risk)
Honda is exposed to equity price risk as a result of its
holdings of marketable equity securities. Marketable equity
securities included in Honda’s investment portfolio are held
for purposes other than trading, and are reported at fair
value, with unrealized gains or losses, net of deferred taxes
included in accumulated other comprehensive income (loss) in
the stockholders’ equity section of the consolidated balance
sheets. At March 31, 2007 and 2008, the estimated fair value
of marketable equity securities was ¥169.2 billion and ¥120.0
billion, respectively.