Honda 2008 Annual Report Download - page 8
Download and view the complete annual report
Please find page 8 of the 2008 Honda annual report below. You can navigate through the pages in the report by either clicking on the pages listed below, or by using the keyword search tool below to find specific information within the annual report.-
 1
1 -
 2
2 -
 3
3 -
 4
4 -
 5
5 -
 6
6 -
 7
7 -
 8
8 -
 9
9 -
 10
10 -
 11
11 -
 12
12 -
 13
13 -
 14
14 -
 15
15 -
 16
16 -
 17
17 -
 18
18 -
 19
19 -
20
-
21
-
22
-
23
-
24
-
25
-
26
-
27
-
28
-
29
-
30
-
31
-
32
-
33
-
34
-
35
-
36
-
37
-
38
-
39
-
40
-
41
-
42
-
43
-
44
-
45
-
46
-
47
-
48
-
49
-
50
-
51
-
52
-
53
-
54
-
55
-
56
-
57
-
58
-
59
-
60
-
61
-
62
-
63
-
64
-
65
-
66
-
67
-
68
-
69
-
70
-
71
-
72
-
73
-
74
-
75
-
76
-
77
-
78
-
79
-
80
-
81
-
82
-
83
-
84
-
85
-
86
-
87
-
88
-
89
-
90
-
91
-
92
-
93
-
94
-
95
-
96
-
97
-
98
-
99
-
100
-
101
-
102
-
103
-
104
-
105
-
106
-
107
-
108
-
109
-
110
-
111
-
112
-
113
-
114
-
115
-
116
-
117
-
118
-
119
-
120
-
121
-
122
-
123
-
124
-
125
-
126
-
127
-
128
 |
 |

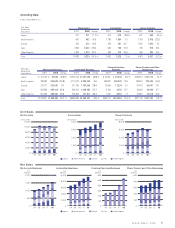
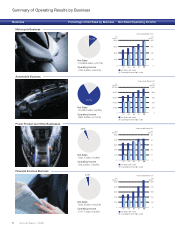
Summary of Operating Results by Business
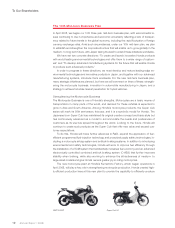
Motorcycle Business
Automobile Business
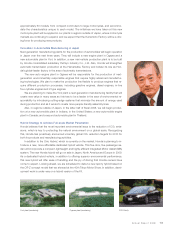
Power Product and Other Businesses
Financial Services Business
Net Sales
¥1,558.6 billion (+13.7%)
Operating Income
¥151.2 billion (+50.4%)
13.0%
Net Sales
¥9,489.3 billion (+6.8%)
Operating Income
¥661.6 billion (+10.4%)
79.1%
Net Sales
¥421.1 billion (+0.8%)
Operating Income
¥22.3 billion (-38.2%)
3.5%
Net Sales
¥533.5 billion (+30.2%)
Operating Income
¥117.7 billion (+2.0%)
4.4%
Net Sales (left scale)
Operating Income (right scale)
1,600
1,200
800
400
0
Yen
(billions) Yen
(billions)
04
160
120
80
40
0
Years ended March 31
08
070605
0
Net Sales (left scale)
Operating Income (right scale)
Yen
(billions) Yen
(billions)
Years ended March 31
10,000
8,000
6,000
4,000
1,000
800
600
400
2,000200
0
04 08
070605
Net Sales (left scale)
Operating Income (right scale)
Yen
(billions) Yen
(billions)
Years ended March 31
500
400
300
200
0
50
40
30
20
100 10
0
04 08
070605
Net Sales (left scale)
Operating Income (right scale)
Yen
(billions) Yen
(billions)
Years ended March 31
500
400
300
200
0
300
240
180
120
10060
0
04 08
070605
Business
Percentage of Net Sales by Business
Net Sales/Operating Income
Annual Report 2008
6