Honda 2008 Annual Report Download - page 93
Download and view the complete annual report
Please find page 93 of the 2008 Honda annual report below. You can navigate through the pages in the report by either clicking on the pages listed below, or by using the keyword search tool below to find specific information within the annual report.-
 1
1 -
2
-
3
-
4
-
5
-
6
-
7
-
8
-
9
-
10
-
11
-
12
-
13
-
14
-
15
-
16
-
17
-
18
-
19
-
20
-
21
-
22
-
23
-
24
-
25
-
26
-
27
-
28
-
29
-
30
-
31
-
32
-
33
-
34
-
35
-
36
-
37
-
38
-
39
-
40
-
41
-
42
-
43
-
44
-
45
-
46
-
47
-
48
-
49
-
50
-
51
-
52
-
53
-
54
-
55
-
56
-
57
-
58
-
59
-
60
-
61
-
62
-
63
-
64
-
65
-
66
-
67
-
68
-
69
-
70
-
71
-
72
-
73
-
74
-
75
-
76
-
77
-
78
-
79
-
80
-
81
-
82
-
 83
83 -
 84
84 -
 85
85 -
 86
86 -
 87
87 -
 88
88 -
 89
89 -
 90
90 -
 91
91 -
 92
92 -
 93
93 -
 94
94 -
 95
95 -
 96
96 -
 97
97 -
 98
98 -
 99
99 -
 100
100 -
 101
101 -
 102
102 -
 103
103 -
104
-
105
-
106
-
107
-
108
-
109
-
110
-
111
-
112
-
113
-
114
-
115
-
116
-
117
-
118
-
119
-
120
-
121
-
122
-
123
-
124
-
125
-
126
-
127
-
128
 |
 |

A n n u a l R e p o r t 2 0 0 8 9 1
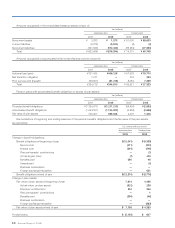
Weighted-average assumptions used to determine benefit obligation at March 31, 2007 and 2008 were as follows:
2007 2008
Japanese plans:
Discount rate 2.0% 2.0%
Rate of salary increase 2.3% 2.3%
Foreign plans:
Discount rate 5.2–6.0% 5.5–6.8%
Rate of salary increase 2.9–6.4% 2.9–6.4%
Weighted-average assumptions used to determine net periodic benefit cost for each of the years in the three-year period
ended March 31, 2008 were as follows:
2006 2007 2008
Japanese plans:
Discount rate 2.0% 2.0% 2.0%
Rate of salary increase 2.3% 2.2% 2.3%
Expected long-term rate of return 4.0% 4.0% 4.0%
Foreign plans:
Discount rate 5.4–6.3% 4.9–5.8% 5.2–6.0%
Rate of salary increase 3.5–6.7% 3.5–5.2% 2.9–6.4%
Expected long-term rate of return 6.8–8.0% 6.8–8.0% 6.5–8.3%
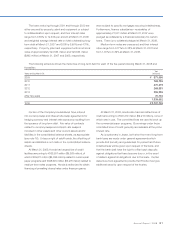
Honda determines the expected long-term rate of return based on the expected long-term return of the various asset
categories. Honda considers the current expectations for future returns and the actual historical returns of each plan asset
category.
Measurement date
Honda uses a March 31 measurement date for their plans excluding certain foreign subsidiaries which use a December 31
measurement date for their plans.
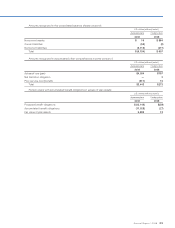
Plan assets
Honda’s domestic and foreign pension plan weighted-average asset allocations at March 31, 2007 and 2008, by asset
category are as follows:
2007 2008
Japanese plans:
Equity securities 43% 36%
Debt securities 36% 43%
Other 21% 21%
100% 100%
Foreign plans:
Equity securities 70% 68%
Debt securities 27% 26%
Other 3% 6%
100% 100%
Honda investment policies for the domestic and foreign pension benefit are designed to maximize total returns that are
available to provide future payments of pension benefits to eligible participants under accepted risks. Honda sets target
assets allocations for the individual asset categories based on the estimated returns and risks in the long future. Plan assets
are invested in individual equity and debt securities using the target assets allocation.