Honda 2008 Annual Report Download - page 51
Download and view the complete annual report
Please find page 51 of the 2008 Honda annual report below. You can navigate through the pages in the report by either clicking on the pages listed below, or by using the keyword search tool below to find specific information within the annual report.-
 1
1 -
2
-
3
-
4
-
5
-
6
-
7
-
8
-
9
-
10
-
11
-
12
-
13
-
14
-
15
-
16
-
17
-
18
-
19
-
20
-
21
-
22
-
23
-
24
-
25
-
26
-
27
-
28
-
29
-
30
-
31
-
32
-
33
-
34
-
35
-
36
-
37
-
38
-
39
-
40
-
 41
41 -
 42
42 -
 43
43 -
 44
44 -
 45
45 -
 46
46 -
 47
47 -
 48
48 -
 49
49 -
 50
50 -
 51
51 -
 52
52 -
 53
53 -
 54
54 -
 55
55 -
 56
56 -
 57
57 -
 58
58 -
 59
59 -
 60
60 -
 61
61 -
62
-
63
-
64
-
65
-
66
-
67
-
68
-
69
-
70
-
71
-
72
-
73
-
74
-
75
-
76
-
77
-
78
-
79
-
80
-
81
-
82
-
83
-
84
-
85
-
86
-
87
-
88
-
89
-
90
-
91
-
92
-
93
-
94
-
95
-
96
-
97
-
98
-
99
-
100
-
101
-
102
-
103
-
104
-
105
-
106
-
107
-
108
-
109
-
110
-
111
-
112
-
113
-
114
-
115
-
116
-
117
-
118
-
119
-
120
-
121
-
122
-
123
-
124
-
125
-
126
-
127
-
128
 |
 |

A n n u a l R e p o r t 2 0 0 8 4 9
of ¥13.4 billion. The other factors had a net positive impact
of ¥15.1 billion. Among such other factors, the effects of
transaction gains and losses had a positive impact, but this
was offset by the negative impact of various factors, including
the net loss associated with the revaluation of assets and
liabilities denominated in foreign currencies, and the absence
of gains on sale of investment securities which were recorded
in the fiscal year ended March 31, 2007.
Income Tax Expense
Income tax expense increased ¥103.5 billion, or 36.5%, to
¥387.4 billion. The effective tax rate was 43.2%, an increase
by 7.4 percentage points from the previous fiscal year. This
increase in the effective tax rate was mainly due to the
recognition of liabilities for unrecognized tax benefits as a
result of an ongoing examination of the Company’s tax filings
by the Tokyo Regional Taxation Bureau with regard to transfer
pricing matters.
Additional detailed information is described in Note 11 to
the accompanying consolidated financial statements.
Minority Interest in Income of Consolidated Subsidiaries
The amount deducted for minority interest in income of
consolidated subsidiaries grew ¥7.1 billion, or 35.7% from the
previous year, to ¥27.3 billion.
Equity in Income of Affiliates
Equity in income of affiliates grew ¥15.5 billion, or 15.0%, to
¥118.9 billion, due mainly to an increase of income at equity
method affiliates in Asia accompanying an increase in their
sales along with market expansion.
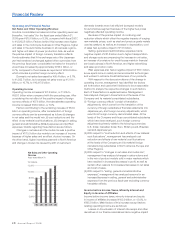
Net Income
Net income rose ¥7.7 billion, or 1.3% from the previous year,
to ¥600.0 billion.
Business Segments
Motorcycle Business
Unit sales of Honda motorcycles, all-terrain vehicles (ATVs)
and personal watercraft (PWC) in fiscal 2008 totaled
9,320,000 units, a decrease of 10.1%, from the previous fiscal
year. Unit sales in Japan were 311,000 units, a decrease of
7.7%. Overseas unit sales in the motorcycle totaled 9,009,000
units, a decrease of 10.2%, due mainly to a decrease in unit
sales of parts for local production at affiliates accounted
for under equity method in Asia, which offset the increase
in unit sales in Other Regions, especially in South America.
Revenue from external customers increased ¥188.0 billion, or
13.7%, to ¥1,558.6 billion, from the previous fiscal year, due
mainly to increased unit sales in Asia and Other Regions, and
the positive impact of foreign currency translation effects.
Honda estimates that if the exchange rate of the Japanese
yen had remained unchanged from the previous fiscal year,
consolidated net sales for the period would have increased
by approximately ¥94.8 billion, or 6.9%, compared to the
increase as reported of ¥188.0 billion, which includes a
positive foreign currency effect.
Operating income increased ¥50.6 billion, or 50.4%, to
¥151.2 billion, from the previous fiscal year, due mainly to a
positive foreign currency effects caused by an appreciation of
Brazilian real and a positive impact of changes in the model
mix, which offset the increased R&D expenses and higher
SG&A expenses.
Automobile Business
Honda’s unit sales of automobiles amounted to 3,925,000
units, up 7.5% from the previous fiscal year. In Japan, unit
sales decreased 8.5%, to 615,000 units. Overseas unit sales
increased 11.1%, to 3,310,000 units, due mainly to increased
unit sales in North America, Europe, Asia and Other Regions.
Revenue from external customers increased ¥600.3
billion, or 6.8%, to ¥9,489.3 billion, from the previous fiscal
year, due to increased unit sales and the positive impact of
the foreign currency translation effects. Honda estimates
that if the exchange rate of the Japanese yen had remained
unchanged from the previous fiscal year, consolidated net
sales for the period would have increased by approximately
¥514.4 billion, or 5.8%, compared to the increase as reported
of ¥600.3 billion, which includes a positive foreign currency
effect.
Operating income increased ¥62.1 billion, or 10.4%, to
¥661.6 billion, from the previous fiscal year, due mainly to
the positive impacts of higher revenue attributable to the
increased unit sales, continuing cost reduction effects,
increased prices, and the positive foreign currency effects,
while offsetting the negative impacts of increased sales
incentives in North America, substantially increased raw
material costs, increased SG&A expenses, changes in the
model mix, higher R&D expenses, and increased depreciation
expenses.
Power Product and Other Businesses
Honda’s unit sales of power products totaled 6,057,000
units, down 5.7% from the previous fiscal year. In Japan, unit
sales totaled 550,000 units, an increase of 4.4%. Overseas
unit sales came to 5,507,000 units, a decrease of 6.6%, due
0
200
400
600
800
08_07_06_05_04_
0
100
200
300
400
08_07_06_05_04_
Net Income and Net Income
per Common Share
Years ended March 31
)neY()snoillib(neY
Net Income (left)
Net Income per Common Share
(right)
0807060504